

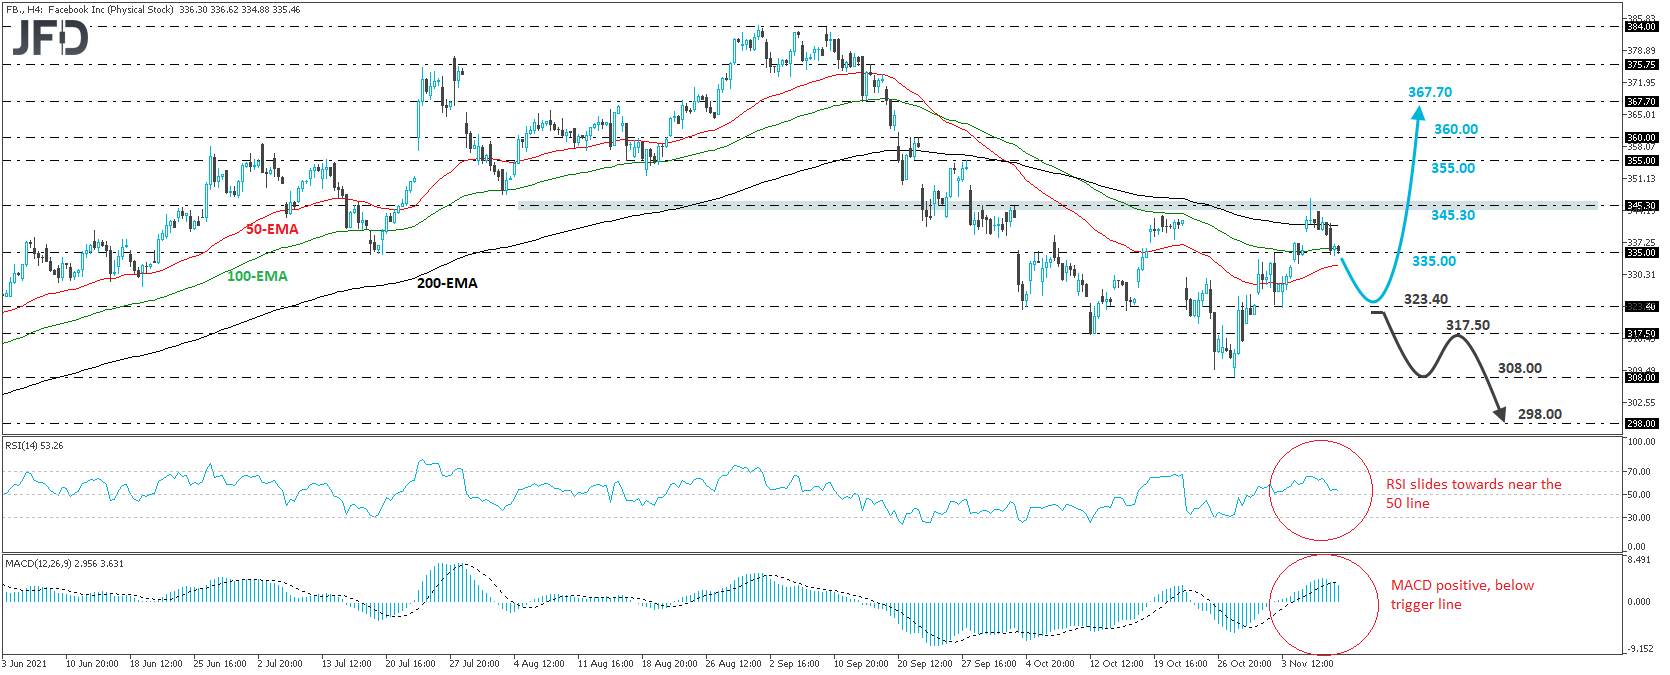
Facebook Inc. (NASDAQ: FB) has been trading in a sliding mode since Friday, when it hit resistance near the 345.30 zone, marked by the high of October 1st. At the time of writing, the stock is testing the 335.00 territory, and even if it breaks lower, bearing in mind that, since October 28th, the price structure has been of higher highs and higher lows, we see decent chances for a notable rebound soon.
A clear dip below 335.00 may pave the way towards the low of November 3rd, at 323.40, from where investors may jump back into the action. They could subsequently aim for another test near the 345.30 territory, and if they manage to overcome it this time around, this will confirm a forthcoming higher high. We could then experience advances towards the 355.00 or 360.00 zones, marked by the highs of September 27th and 21st respectively, and if neither barrier is able to stop the stock from drifting further north, then we could see it climbing towards the inside swing low of September 15th, at 367.70.
Shifting attention to our short-term oscillators, we see that the RSI turned down after it hit resistance slightly below its 70 line and it now lies slightly above its 50 line, while the MACD, although positive, runs below its trigger line, pointing down. Both indicators detect slowing upside speed and support the notion for some further declines before the next leg north.
In order to abandon the bearish case, we would like to see a dip below 323.40. This will confirm a forthcoming lower low on the 4-hour chart and may initially target the low of October 12th, at 317.50. Another dip, below 317.50, could pave the way toward the low of October 28th, at 308.00, the break of which could extend the fall towards the 298.00 zone, defined as a support by the low of May 12th.
Disclaimer:
The content we produce does not constitute investment advice or investment recommendation (should not be considered as such) and does not in any way constitute an invitation to acquire any financial instrument or product. The Group of Companies of JFD, its affiliates, agents, directors, officers or employees are not liable for any damages that may be caused by individual comments or statements by JFD analysts and assumes no liability with respect to the completeness and correctness of the content presented. The investor is solely responsible for the risk of his investment decisions. Accordingly, you should seek, if you consider appropriate, relevant independent professional advice on the investment considered. The analyses and comments presented do not include any consideration of your personal investment objectives, financial circumstances or needs. The content has not been prepared in accordance with the legal requirements for financial analyses and must therefore be viewed by the reader as marketing information. JFD prohibits the duplication or publication without explicit approval.
There are risks involved with trading of cash equities. Past performance is not indicative of future results. You should consider whether you can tolerate such losses before trading. Please read the full Risk Disclosure.
Copyright 2021 JFD Group Ltd.