

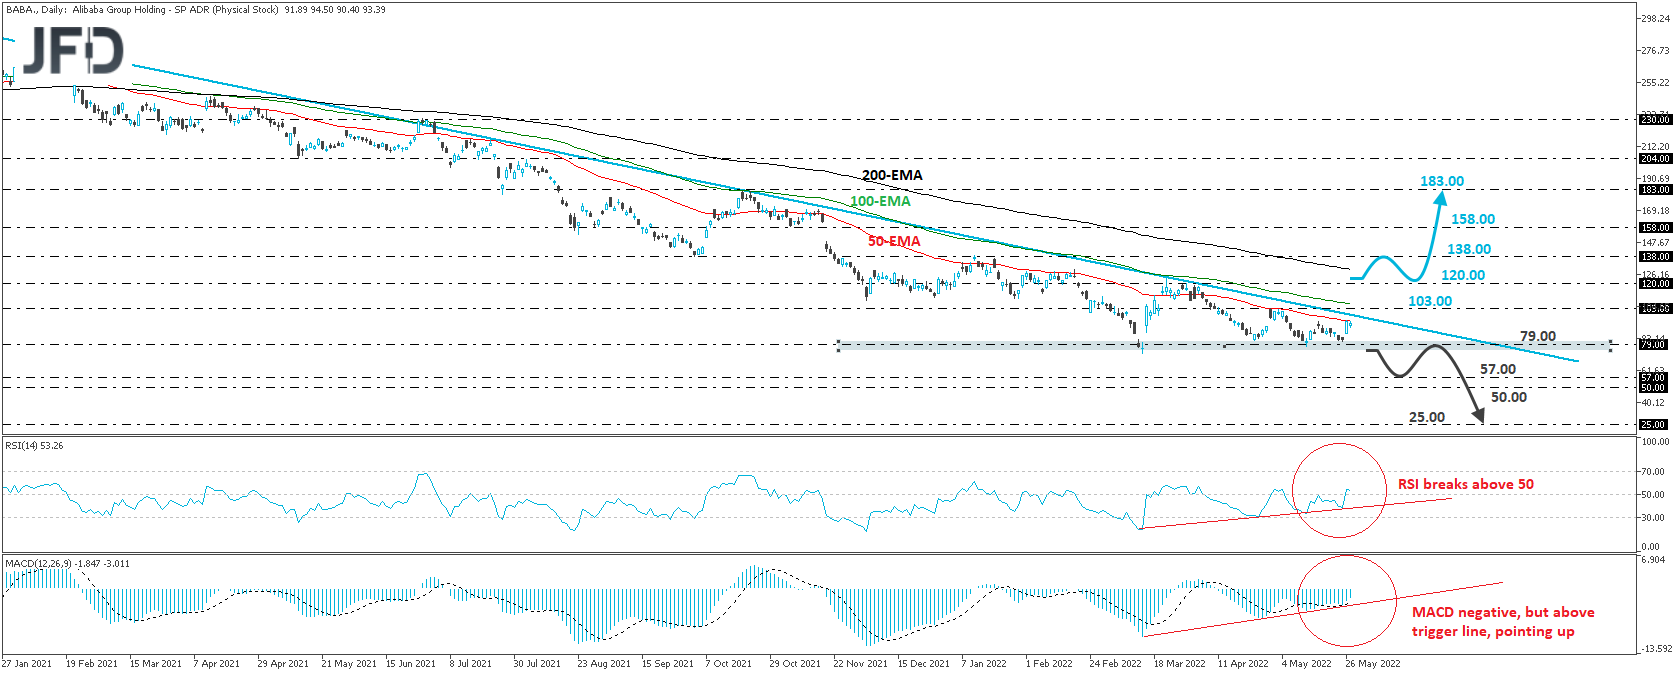
The Alibaba Group Holding Ltd share (NYSE: BABA) traded higher last week, after hitting support near the 79.00 zone. That zone has acted as a key support area since March 14th, but the stock remained below the long-term downside resistance line taken from the peak of October 27th. The fact that it stays below that line keeps the downtrend intact, but bearing in mind that the buying activity near 79.00, we prefer to take a neutral stance for now.
Taking a look at our short-term oscillators, we see that there is positive divergence between both of them and the price action, while the RSI jumped above its 50 line. Although the MACD remains negative, it is running above its trigger line, and it is pointing up, suggesting that it could turn positive soon. These momentum signals are another reason we are not confident on a trend continuation. Maybe the downtrend has run its course.
A clear break above the downside line, and even better in our view, above 120.00, could confirm a bullish reversal and may initially target the 138.00 zone, marked by the high of January 12th, and the inside swing low of October 4th, where another break could see scope for extensions towards the 158.00 barrier, marked by the inside swing low of November 5th. If market participants are not willing to stop there either, then we may see them pushing towards the 183.00 area, defined as a resistance by the peak of October 20th.
On the downside, we would like to see a dip below 79.00, which would mean that there is no interest in that stock at that level anymore, and thus, further declines could be possible. This will confirm a forthcoming lower low and could initially target the 57.00 zone, which acted as a temporary floor between August 2015 and February 2016. Now, with no historic data available to mark the next possible support zones, we will go for psychological numbers, like 50.00 and 25.00.
Disclaimer:
The content we produce does not constitute investment advice or investment recommendation (should not be considered as such) and does not in any way constitute an invitation to acquire any financial instrument or product. The Group of Companies of JFD, its affiliates, agents, directors, officers or employees are not liable for any damages that may be caused by individual comments or statements by JFD analysts and assumes no liability with respect to the completeness and correctness of the content presented. The investor is solely responsible for the risk of his investment decisions. Accordingly, you should seek, if you consider appropriate, relevant independent professional advice on the investment considered. The analyses and comments presented do not include any consideration of your personal investment objectives, financial circumstances or needs. The content has not been prepared in accordance with the legal requirements for financial analyses and must therefore be viewed by the reader as marketing information. JFD prohibits the duplication or publication without explicit approval.
There are risks involved with trading of cash equities. Past performance is not indicative of future results. You should consider whether you can tolerate such losses before trading. Please read the full Risk Disclosure.
Copyright 2022 JFD Group Ltd.