


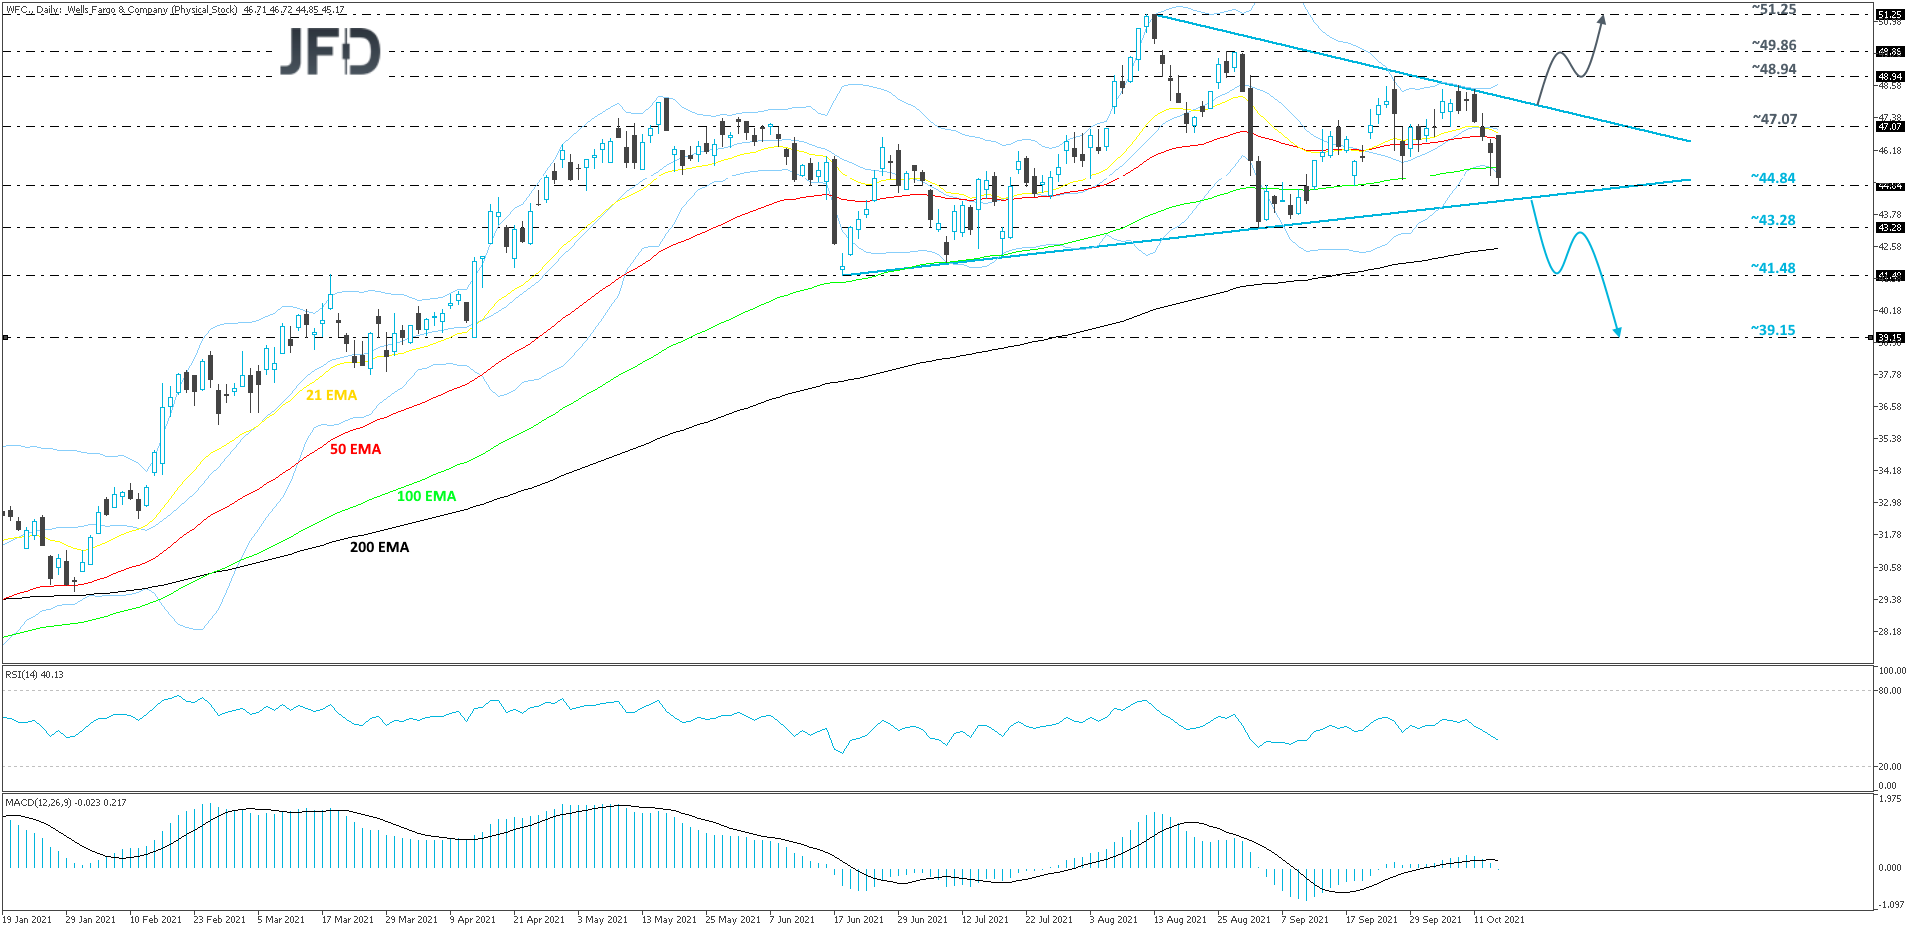
The technical picture of the Wells Fargo & Co stock (NYSE: WFC) on our daily chart shows that after reversing higher in the beginning of November 2020 it trended north, but from August this year the price action started forming a triangle pattern. WFC is now seen getting more and more squeezed. In order to consider the next short-term directional move, we would like to see a violation of one of the sides of the triangle first. Hence our neutral stance for now.
If the lower side of the aforementioned triangle gets broken, this may spark fear among a few more buyers, as such a move might hold them off from stepping in. The stock could then drift to the 43.28 obstacle, or even to the 41.48 zone, marked by the lowest point of June, where a temporary hold-up might occur. That said, if the slide continues, the next possible target could be at 39.15, which is the low of April 14th.
The RSI is currently slightly below 50, but it has been oscillating around that mark from around mid-September. The MACD had just moved slightly below zero, while remaining under the trigger line. Although our indicators are showing rising downside speed of the price, meaning that a move lower in the near-term could be possible, we would rather stick to the idea of seeing a break of the lower side of the previously mentioned triangle before targeting the downside.
Alternatively, if the share price pops above the upper bound of that triangle, more buyers could join in and drag WFC towards the 48.94 obstacle, or the 49.86 hurdle, marked by the high of August 26th. If the buyers are still not done with the stock at that price, they may push it further north, aiming for the 51.25 level, which is the highest point of August.
Disclaimer:
The content we produce does not constitute investment advice or investment recommendation (should not be considered as such) and does not in any way constitute an invitation to acquire any financial instrument or product. The Group of Companies of JFD, its affiliates, agents, directors, officers or employees are not liable for any damages that may be caused by individual comments or statements by JFD analysts and assumes no liability with respect to the completeness and correctness of the content presented. The investor is solely responsible for the risk of his investment decisions. Accordingly, you should seek, if you consider appropriate, relevant independent professional advice on the investment considered. The analyses and comments presented do not include any consideration of your personal investment objectives, financial circumstances or needs. The content has not been prepared in accordance with the legal requirements for financial analyses and must therefore be viewed by the reader as marketing information. JFD prohibits the duplication or publication without explicit approval.
There are risks involved with trading of cash equities. Past performance is not indicative of future results. You should consider whether you can tolerate such losses before trading. Please read the full Risk Disclosure.
Copyright 2021 JFD Group Ltd.