


Equities around the globe fell sharply yesterday and today in Asia, perhaps due to hedge funds with short positions in GameStop and other meme stocks closing long positions in other stocks to cover their losses. The Fed’s concerns over the US economic recovery may have also weighed on market sentiment.
USD Rebounds as Equities Fall on Short Squeeze Fallout
The US dollar traded higher against all the other G10 currencies on Wednesday and during the Asian session Thursday. It gained the most ground versus NOK, AUD, and NZD in that order, while it outperform the least against CHF, GBP, EUR, and JPY.
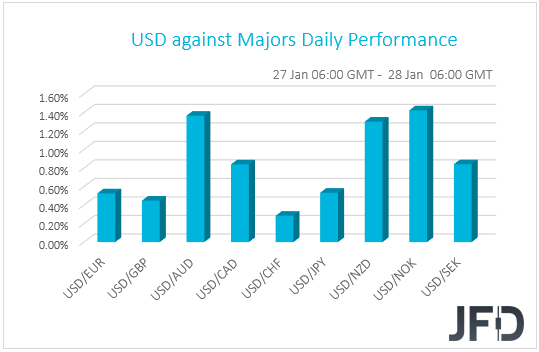
The relative strength of the US dollar, the Swiss franc and the Japanese yen, combined with the weakening of the risk-linked Aussie and Kiwi, suggests that markets traded in a risk-off manner yesterday and today in Asia. Indeed, turning our gaze to the equity world, we see that EU and US indices were a sea of red, with Wall Street suffering the most in three months. The risk aversion rolled over into the Asian session today, with Japan’s Nikkei and China’s Shanghai Composite falling 1.53% and 1.91% respectively.
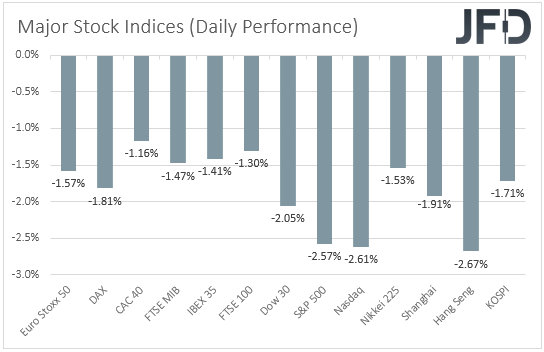
There was no clear catalyst behind the tumble in equities, but market chatter suggests that it may have been due to hedge funds with short positions in GameStop and other meme stocks closing long positions in other stocks to cover their losses, following the frenzy rally in the former group. The slowdown in the covid vaccinations rollouts in Europe and the US may have also weighed on market sentiment. On top of that Wall Street accelerated its tumble following the FOMC decision.
The Fed decided to keep its monetary policy settings unchanged, with the only material change in the statement being the part saying that “the pace of the recovery in economic activity and employment has moderated in recent months”. Although at the press conference following the decision Fed Chair Powell clearly stated that it’s too early to focus on tapering dates, it seems that investors paid more attention to the concerns over the economic recovery.
As for our view, we still believe that the bigger picture of equities remains positive. Yes, the current retreat may continue for a while more, but we would treat this as a corrective phase. The GameStop phenomenon will likely prove to be temporary, while with regards to the coronavirus, we still believe that the worst is behind us. Even at a slower-than-expected pace, the vaccinations around the globe continue, something that may eventually allow lockdown measures to be lifted and thereby let the global economy to recover. The extra-loose monetary policy worldwide, and a large fiscal spending package in the US may also help market sentiment to improve.
DJIA – Technical Outlook
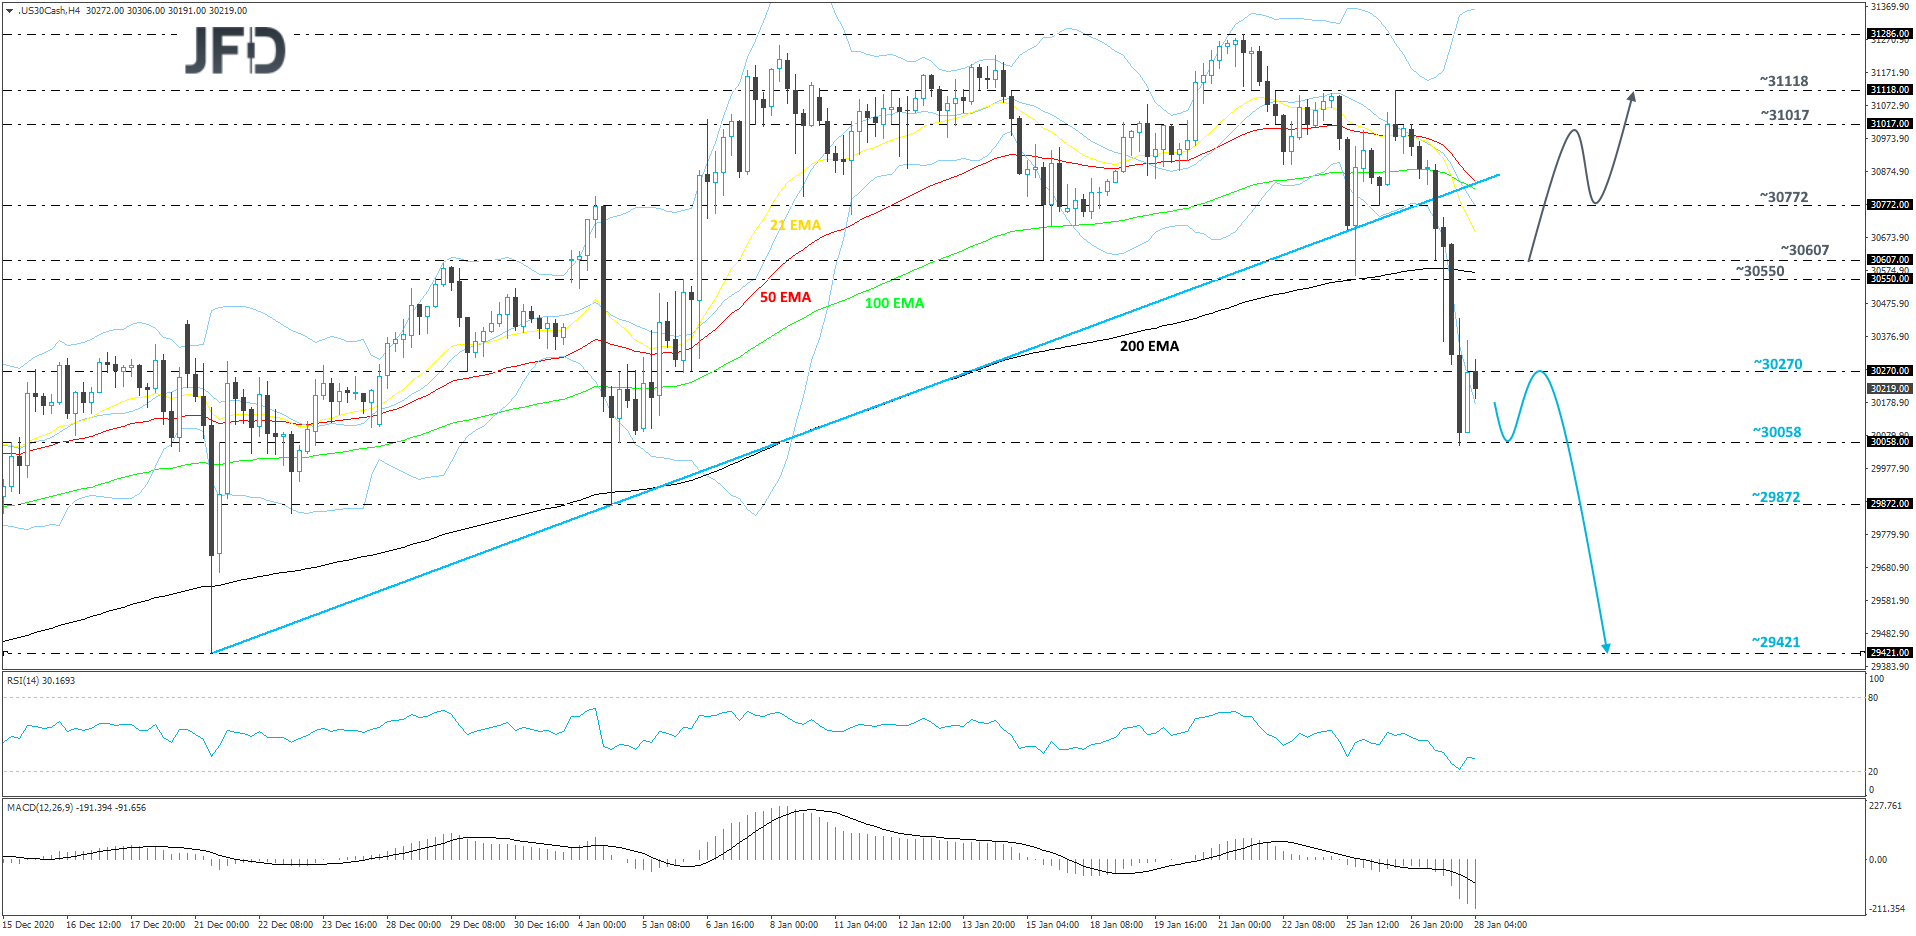
The DJIA index experienced a big drop yesterday, which led to a break of the short-term upside support line, drawn from the low of December 21st. The index found temporary support just slightly above the psychological 30000 mark, which may keep the price bouncing above it for a while more. That said, given the current negativity in the market, in combination with the end-of-month profit taking, there is a possibility to see a bit more downside in the near term. Hence our somewhat negative approach for now.
As mentioned above, the index might stall for a bit, slightly above the psychological 30000 zone. But if, eventually, that area surrenders, the sellers may drive DJIA to the next possible support hurdle, at 29872, marked by the current lowest point of January. If the buyers are still nowhere to be found, a further decline could bring the index to the 29421 level. That level marks the low of December 21st.
In order to shift our attention to some higher areas again, we would like to see a move back above the 200 EMA and above the 30607 zone, marked by the low of January 15th. This way, more buyers may join in and help elevate DJIA even more. The price might push to the 30772 obstacle, or even to the 31017 hurdle, marked by an intraday swing high of January 26th. Slightly above it sits another potential target, at 31118, which is the high of January 26th.
AUD/USD – Technical Outlook
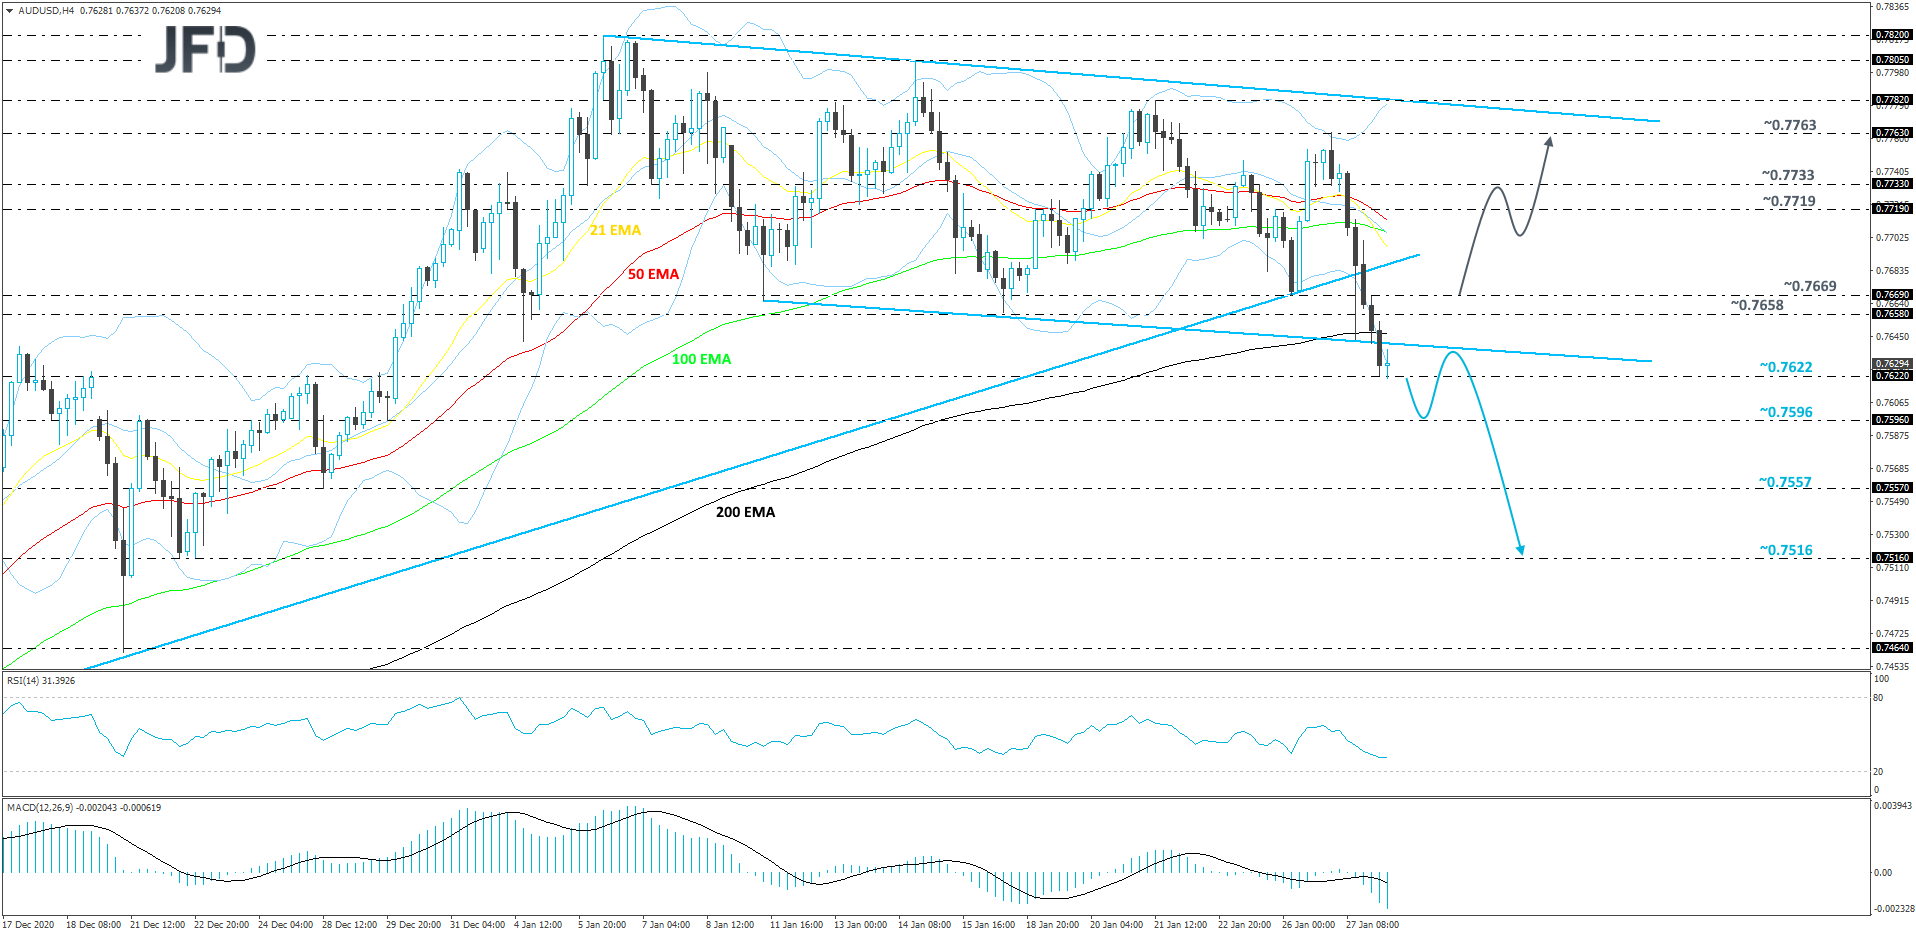
From around the beginning of January, AUD/USD has been trading within a downward-moving channel. However, up until yesterday, the pair remained above its short-term upside support line, taken from the low of November 13th, but then the rate fell sharply. This morning, AUD/USD is trading below that upside line and below the lower bound of the falling channel. All this paints a slightly more negative picture, at least for now.
There is a possibility to see the rate drifting further south, potentially aiming for the 0.7596 territory, marked by an intraday swing low of December 29th. The pair may stall there, or even correct back up a bit. That said, if AUD/USD finds it hard to climb back above the lower bound of the aforementioned channel, the bears could take advantage of the higher rate and push it lower again. A slide below the 0.7596 obstacle might bring the pair closer to the 0.7557 hurdle, marked by the low of December 28th, or even to the 0.7516 level. That level is the low of December 22nd.
Alternatively, if the rate is able to get back above the lower side of that channel and then rise above the 0.7669 barrier, marked by the low of January 26th, that may open the door for a further uprise. AUD/USD could end up traveling to the territory between the 0.7719 and 0.7733 levels, marked by an intraday swing high of January 25th and an intraday swing low of January 27th. However, if the buyers are still active, the next possible target may be at 0.7763, which is yesterday’s high.
As for Today’s Events
We get the German preliminary inflation data for January and the 1st estimate of the US GDP for Q4. Both Germany’s CPI and HICP rates are expected to have rebounded to +0.7% yoy and +0.5% yoy from -0.3% and -0.7% respectively. This could raise speculation that Eurozone’s headline inflation may also exit the negative territory. As for the US GDP, following the 31.4% qoq SAAR tumble in Q2, it rebounded 33.4% in Q3, and now it is expected to normalize at around 4.0% in the last quarter of 2020. The US new home sales for December and the initial jobless claims for last week are also coming out. New home sales are expected to have rebounded 1.5% mom after a 11.0% slide in November, while jobless claims are anticipated to have declined somewhat, to 875k from 900k.
As for tonight, during the Asian session Friday, we get the usual end of month data dump from Japan. The unemployment rate is forecast to have ticked up to 3.0% form 2.9%, while the jobs-to-applications ratio is expected to have held steady at 1.06. The Tokyo core CPI is anticipated to have increased to -0.6% yoy from -0.9%, while no forecast is available for the headline print. Japan’s preliminary industrial production for December is expected to have fallen 1.5% mom after sliding 0.5% in November. The summary of opinions from last week’s BoJ monetary policy meeting is also coming out.
We also have one speaker on today’s agenda and this is ECB Executive Board member Isabel Schnabel.
Disclaimer:
The content we produce does not constitute investment advice or investment recommendation (should not be considered as such) and does not in any way constitute an invitation to acquire any financial instrument or product. The Group of Companies of JFD, its affiliates, agents, directors, officers or employees are not liable for any damages that may be caused by individual comments or statements by JFD analysts and assumes no liability with respect to the completeness and correctness of the content presented. The investor is solely responsible for the risk of his investment decisions. Accordingly, you should seek, if you consider appropriate, relevant independent professional advice on the investment considered. The analyses and comments presented do not include any consideration of your personal investment objectives, financial circumstances or needs. The content has not been prepared in accordance with the legal requirements for financial analyses and must therefore be viewed by the reader as marketing information. JFD prohibits the duplication or publication without explicit approval.
CFDs are complex instruments and come with a high risk of losing money rapidly due to leverage. 72.57% of retail investor accounts lose money when trading CFDs with the Company. You should consider whether you understand how CFDs work and whether you can afford to take the high risk of losing your money. Please read the full Risk Disclosure.
Copyright 2021 JFD Group Ltd.