

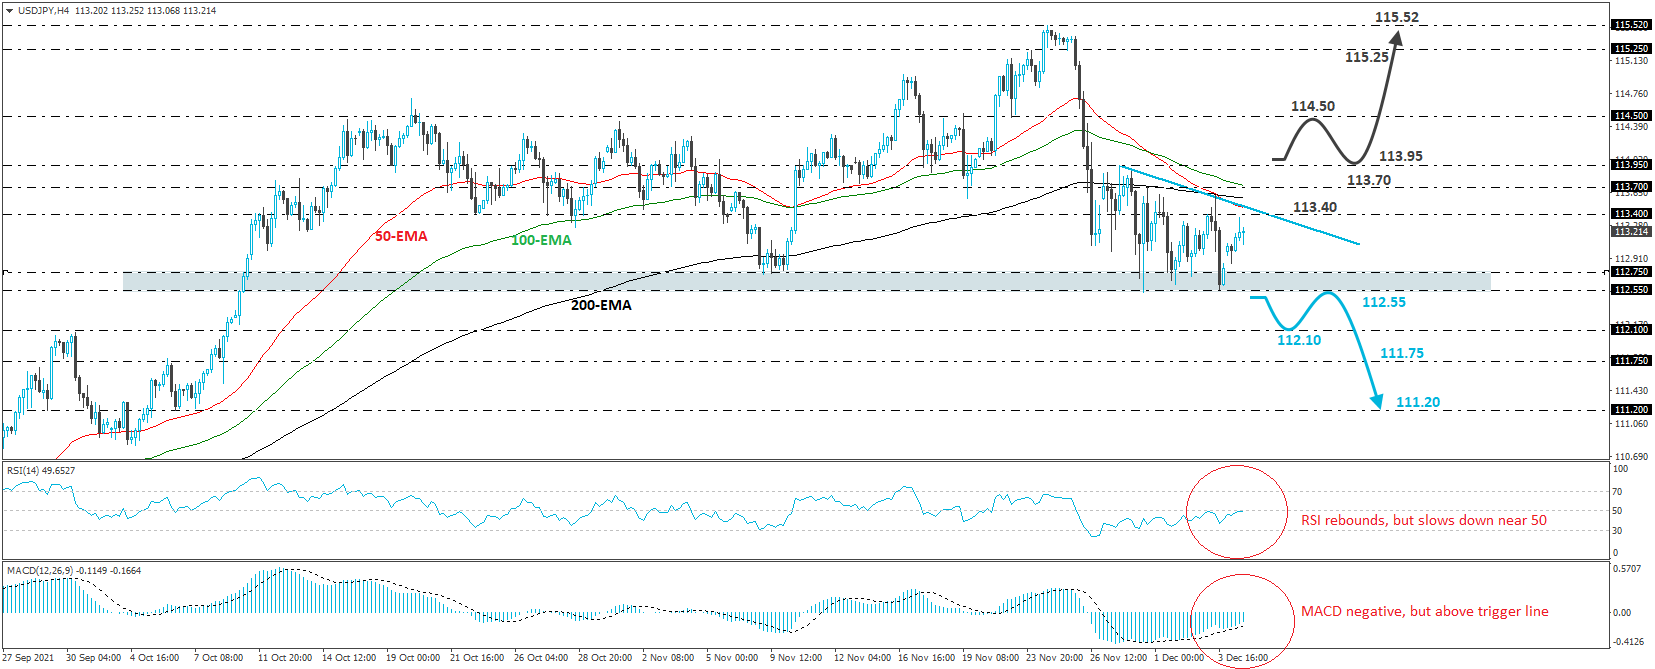
USD/JPY traded higher on Monday, after hitting support at 112.55 on Friday. Overall, the pair remains below the downside resistance line taken from the high of November 29th, but it also remains supported by the 112.55/75 zone. The last time we saw the pair below that zone was back on October 11th. With all that in mind, we will adopt a cautiously negative stance for now.
In order to get confident that the rate could drift further south, we would like to see a clear and decisive dip below 112.55. This will confirm a forthcoming lower low on the 4-hour chart and may see scope for declines towards the 112.10 barrier, marked by the inside swing high of September 30th. Another break, below 112.10, could extend the fall towards the inside swing high of October 6th, at around 111.75. If that barrier doesn’t hold either, then we could see the pair dropping towards the lows of October 6th and 7th, at 111.20.
Shifting attention to our short-term oscillators, we see that the RSI rebounded, but has started to flatten near its 50 line, while the MACD, although negative, still stands above its trigger line. Both indicators still detect negative momentum, but a slowing one, which makes us cautious over some further recovery before the next leg south. The flattening of the RSI suggests that the upside could still be halted near the downside line taken from the high of November 29th.
Alternatively, in order to start examining the bullish case, we would like to see a break above the 113.95 barrier, marked by the high of November 29th. The rate would already be well above the aforementioned downside line and it could initially travel towards the inside swing low of November 23rd, at 114.50. If the bulls are not willing to stop there, then they could climb towards the 115.25 level, or the 115.52 hurdle, defined by the inside swing low of November 25th and the peak of the day before.
Disclaimer:
The content we produce does not constitute investment advice or investment recommendation (should not be considered as such) and does not in any way constitute an invitation to acquire any financial instrument or product. The Group of Companies of JFD, its affiliates, agents, directors, officers or employees are not liable for any damages that may be caused by individual comments or statements by JFD analysts and assumes no liability with respect to the completeness and correctness of the content presented. The investor is solely responsible for the risk of his investment decisions. Accordingly, you should seek, if you consider appropriate, relevant independent professional advice on the investment considered. The analyses and comments presented do not include any consideration of your personal investment objectives, financial circumstances or needs. The content has not been prepared in accordance with the legal requirements for financial analyses and must therefore be viewed by the reader as marketing information. JFD prohibits the duplication or publication without explicit approval.
CFDs are complex instruments and come with a high risk of losing money rapidly due to leverage. 68.02% of retail investor accounts lose money when trading CFDs with the Company. You should consider whether you understand how CFDs work and whether you can afford to take the high risk of losing your money. Please read the full Risk Disclosure.
Copyright 2021 JFD Group Ltd.