


The dollar continued drifting north yesterday, buoyed by the optimism surrounding the US-China “phase one” deal, as well as by the bigger-than-expected rebound in the ISM non-manufacturing index for October. The Kiwi was the main loser among the G10s, coming under selling interest after New Zealand’s soft employment report for Q3.
ISM non-manuf. Rebounds More than Expected, NZ Jobs Report Disappoints
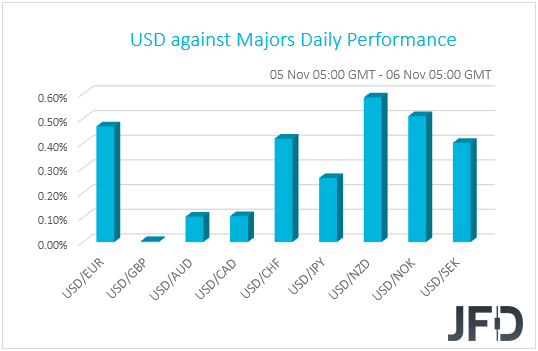
The dollar continued trading higher against all but one of the other G10 currencies on Tuesday and during the Asian morning Wednesday. It gained the most against NZD, NOK and CHF in that order, while the currency against which it failed to eke out any gains was GBP.
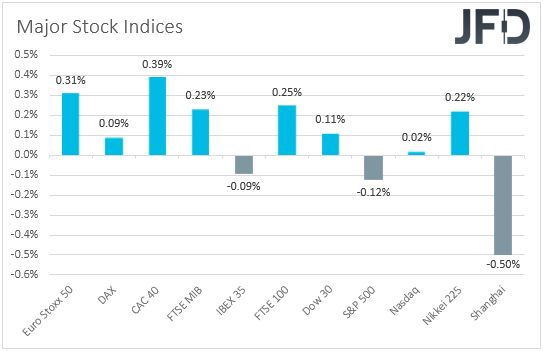
Although not clear by the performance in the FX sphere, equity investors’ morale remained somewhat supported during the EU and US sessions, perhaps due to optimism surrounding the US-China “phase one” deal. The exceptions were Spain’s IBEX 35 and the S&P 500, which slid 0.09% and 0.12% respectively. That said, sentiment was even more mixed during the Asian morning today, perhaps due to headlines that China will not accept any deal if the US only suspends tariffs that it has threatened to impose. The US should also roll back some if the existing tariffs, according to a former Chinese trade official. Although Japan’s Nikkei gained 0.22%, China’s Shanghai Composite slid 0.50%.
Back to the dollar, apart from some trade optimism, at least throughout most of the day, it may have been also helped by the better-than-expected ISM non-manufacturing index for October, which rebounded to 54.7 from its three-year low of 52.6. The forecast was for a smaller rebound, to 53.5. The combo of trade hopes and a better ISM print also pushed Gold sharply lower, with the precious metal losing nearly 1.5% and hitting support fractionally below 1480. Another interesting development is that despite the strong dollar, USD/CNH fell back below the 7.0000 mark, after staying above it for almost three months.
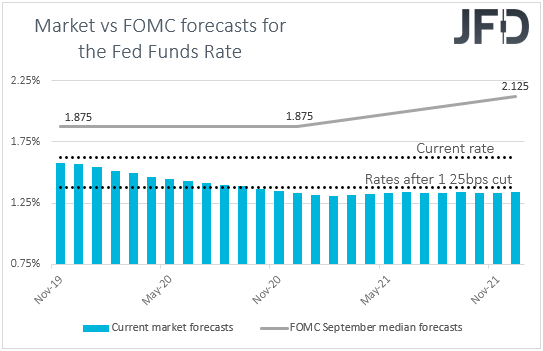
Yesterday, we noted that a rebound in the ISM index is unlikely to vanish expectations over more Fed cuts, despite the Committee signaling that it is planning to take the sidelines. Indeed, it just prompted market participants to push the timing of when they expect the next cut to be delivered, from July next year to September.
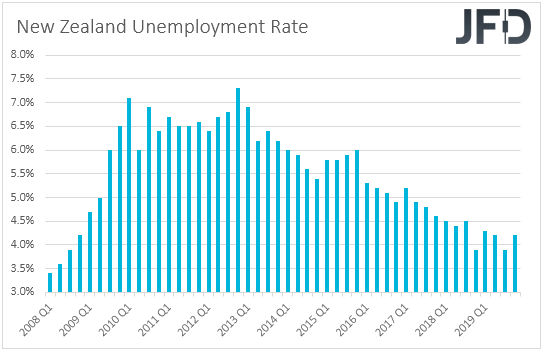
Now flying from the US to New Zealand, overnight, during the early Asian trading today, the nation released its official employment data for Q3. The unemployment rate rose to 4.2% from 3.9%, missing the forecast of 4.1%, while the employment change revealed a slowdown in jobs growth to +0.2% qoq from +0.8%. Expectations were for a slowdown to +0.3% qoq. The Labor Cost Index slowed as well, to +0.6% from +0.8%. Yesterday morning, we noted that market participants were more convinced than not, that the Bank will cut rates at its upcoming meeting, assigning a 52% chance for such an action. The softer than expected jobs report pushed that percentage up to 67% and the Kiwi lower, with the currency found as the main loser among the G10s this morning.
USD/JPY – Technical Outlook
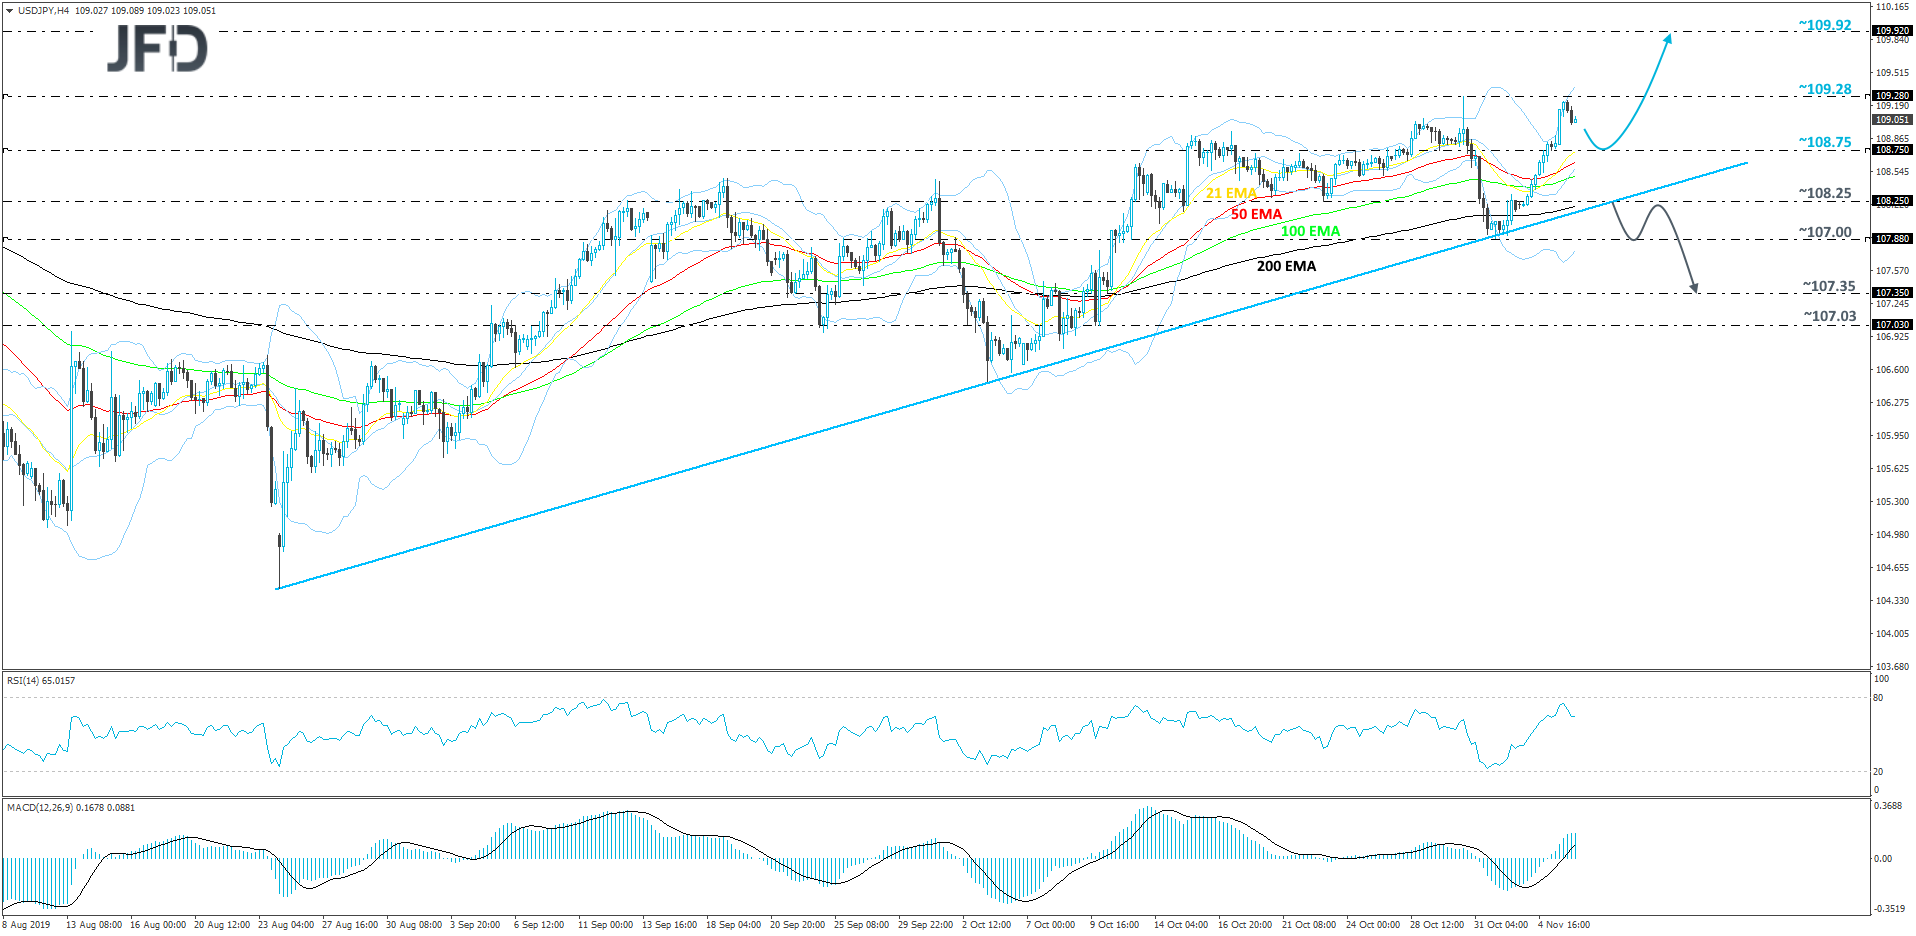
From the beginning of this week, USD/JPY climbed higher, but after finding strong resistance near the 109.28 hurdle, the pair reversed slightly lower. For now, this reversal could still be seen as a temporary correction, as the rate remains above its short-term upside support line drawn from the low of August 25th. Although we may see a bit more downside, as long as USD/JPY stays above the previously mentioned upside line, we will continue looking north, at least in the short run.
A small slide lower could test the 108.75 zone, which marks the high of October 24th and the low of October 29th. If that area provides descent support, the rate might rebound and push back up again, aiming for the 109.28 hurdle, which recently kept the pair down. If this time that hurdle surrenders to the buyers, its break may clear the path to the 109.92 level, marked by the high of May 30th.
Alternatively, a break of the aforementioned upside line and a rate-drop below the 108.25 area, marked by the low of October 23rd and by an intraday swing high of November 1st, could spook the bulls from the field and allow the bears to take control, at least for a bit. We will then examine a possible test of the 107.88 obstacle, the current lowest point of November, a break of which may send USD/JPY to the next potential support level, at 107.35, marked by the low of October 10th.
NZD/CAD – Technical Outlook
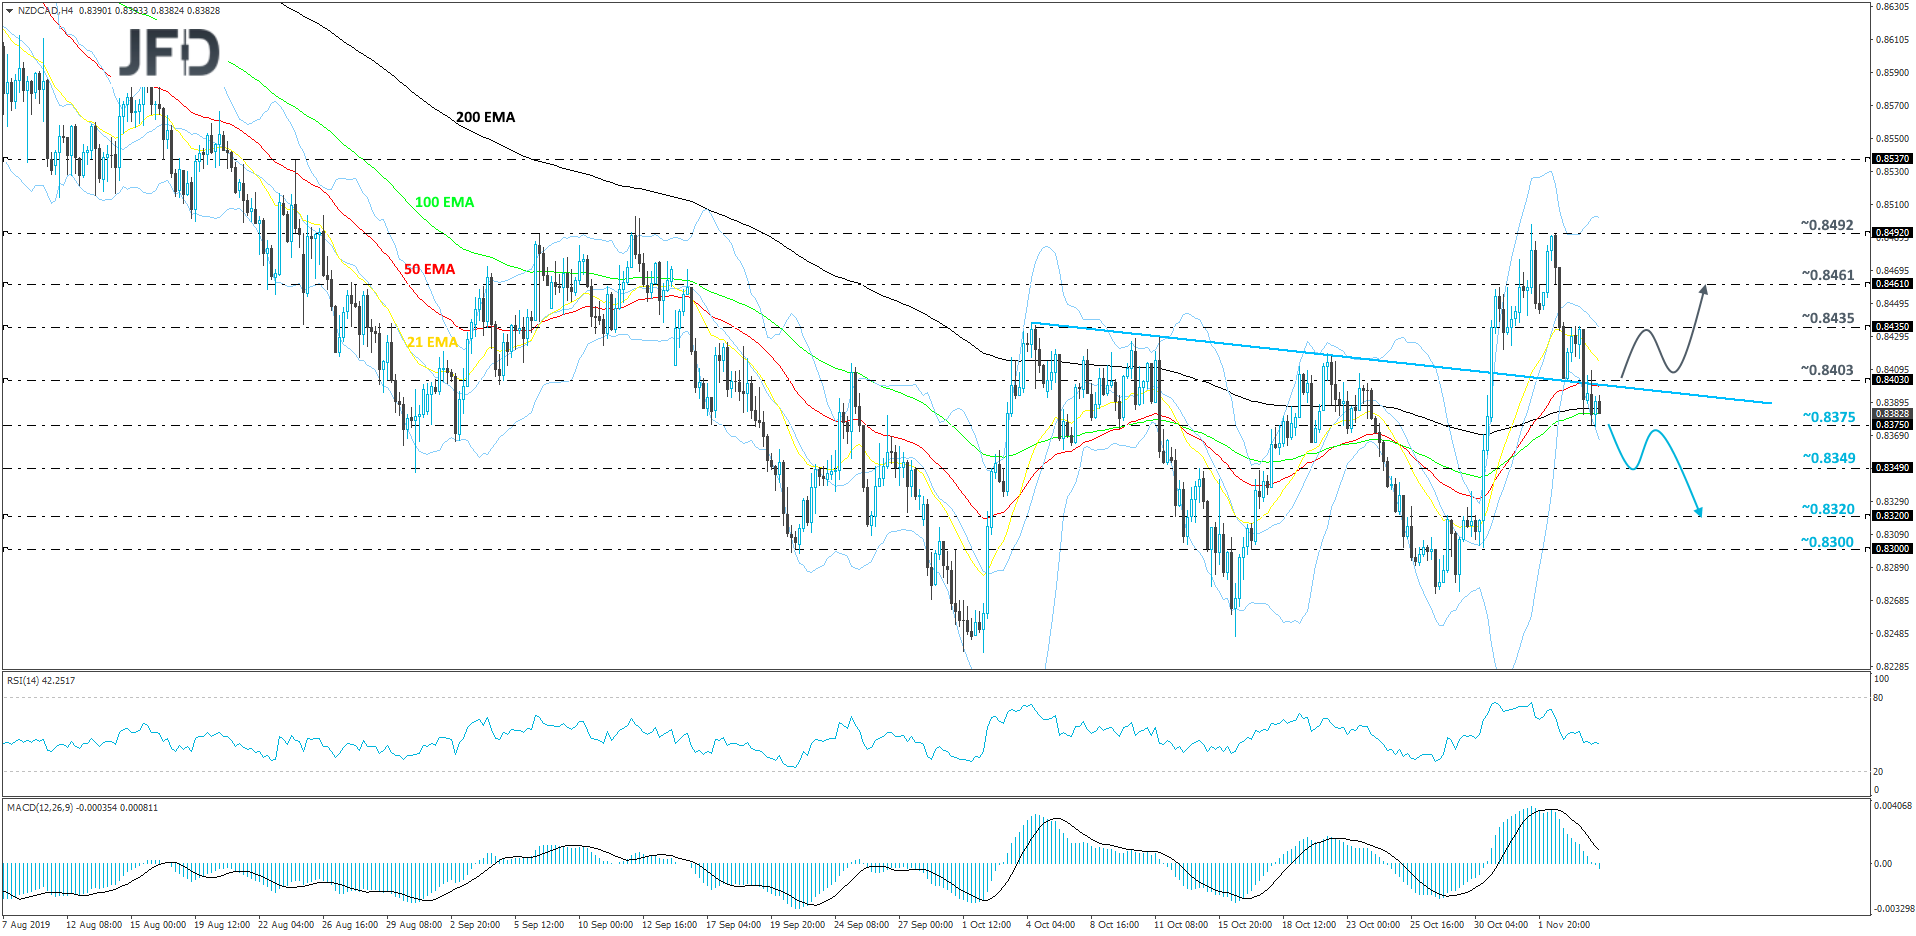
After finding strong resistance near the 0.8492 hurdle on Monday, NZD/CAD drifted lower and eventually ended up breaking back below its short-term downside resistance line drawn from the high of October 4th. It seems that the bulls are getting spooked off the field, which could allow more bears to join in. Our oscillators, the RSI and the MACD, are showing increasing downside speed, which supports the bearish outlook, at least for now.
A further move down and a drop below this morning’s low, at 0.8375, could open the door for another move south, where we might target the 0.8349 zone, marked by an inside swing high of October 15th. If that area fails to withstand the bear-pressure, its break could set the stage for a further move down towards the 0.8320 level, marked near the high of October 29th.
On the upside, in order to consider higher levels again, a push back above the aforementioned downside line is needed. In addition to that, to get comfortable with a stronger upside leg, a break above the 0.8403 barrier would be something that we would looking out for. Such a move could attract more buyers into the game and the rate might drift to the 0.8435 hurdle, marked by yesterday’s high. The pair may stall there initially, but if the buying remains strong, a break of that obstacle could lead NZD/CAD to the 0.8461 level, which is an intraday swing low of November 4th.
As for the Rest of Today’s Events
During the European morning, we have the final services and composite PMIs for October from the Eurozone, but as it is usually the case, they are expected to confirm their preliminary prints. The bloc’s retail sales for September are also due to be released. The forecast suggests a slowdown to +0.1% mom from +0.3%, but this could drive the yoy rate up to +2.5% from +2.1%.
Later in the day, from the US, we get the preliminary Unit Labor Costs index for Q3, which is forecast to have slowed to +2.2% from +2.6%, and the EIA (Energy Information Administration) weekly report on crude oil inventories, which is expected to reveal a slowdown to 1.515mn barrels from 5.702mn previously.
We also have three Fed speakers on today’s schedule: New York President John Williams, Chicago Fed President Charles Evans, and Philadelphia Fed President Patrick Harker.
Disclaimer:
The content we produce does not constitute investment advice or investment recommendation (should not be considered as such) and does not in any way constitute an invitation to acquire any financial instrument or product. The Group of Companies of JFD, its affiliates, agents, directors, officers or employees are not liable for any damages that may be caused by individual comments or statements by JFD analysts and assumes no liability with respect to the completeness and correctness of the content presented. The investor is solely responsible for the risk of his investment decisions. Accordingly, you should seek, if you consider appropriate, relevant independent professional advice on the investment considered. The analyses and comments presented do not include any consideration of your personal investment objectives, financial circumstances or needs. The content has not been prepared in accordance with the legal requirements for financial analyses and must therefore be viewed by the reader as marketing information. JFD prohibits the duplication or publication without explicit approval.
78% of the retail investor accounts lose money when trading CFDs with this provider. You should consider whether you can afford to take the high risk of losing your money. Please read the full Risk Disclosure.