

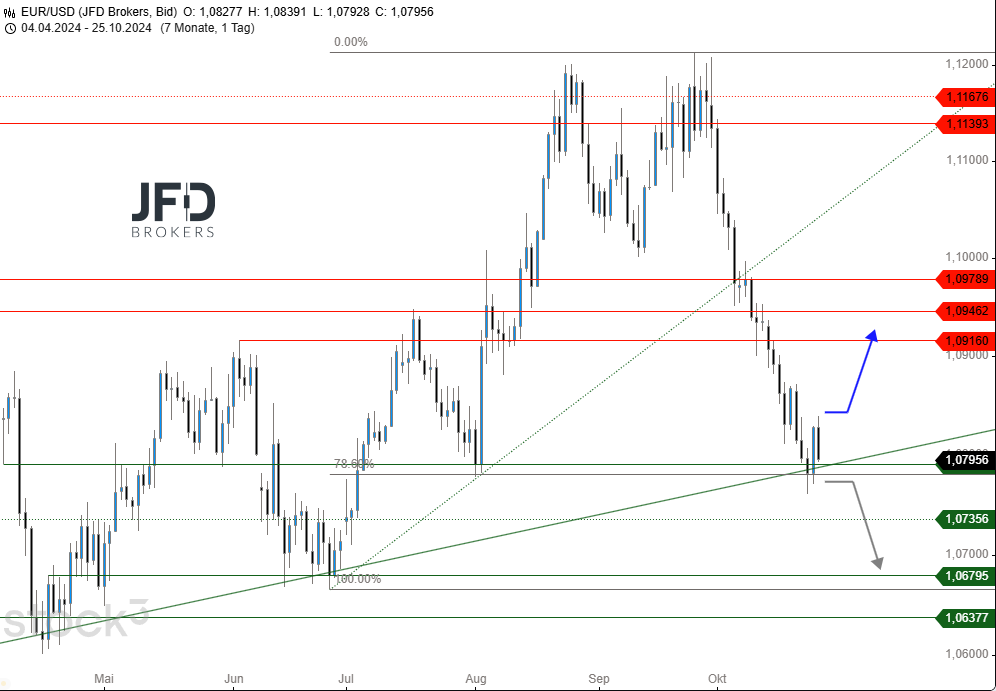
EUR/USD remains in difficulty
.
The depreciation actually continued until around 1.0790 USD in the previous week. However, the possible breakthrough was prevented and the upcoming trading week is therefore all the more exciting.
The support area of 1.0790 USD has several parameters so this level can be described as cross-support. In the wake of initial reactions around this area, there is again the possibility of a recovery in the direction of 1.0910 USD to a maximum of 1.0946 USD. However, the strength is not likely to be enough for more than a technical counter-reaction.
If, on the other hand, the low of Thursday at 1.0770 USD is breached, one should prepare for a sustained weakness in the euro. As a consequence, the euro is likely to drop to 1.0730 USD and below to around 1.0700 USD. Unsurprisingly, the overall chart picture remains bleak.
.
.
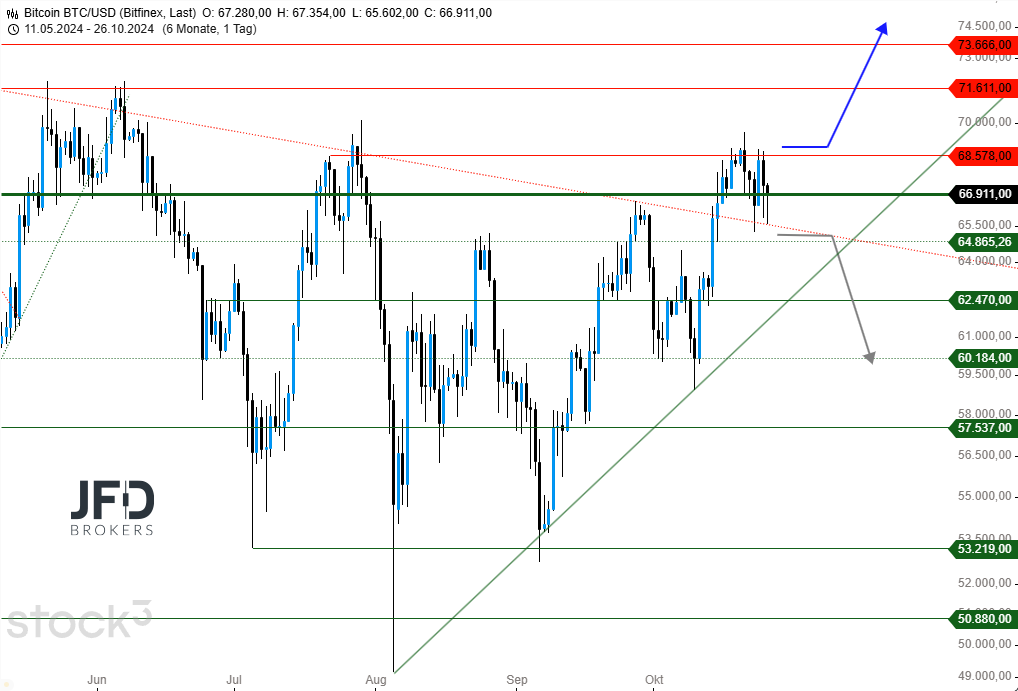
Bitcoin (USD) - the calm before the storm?
.
Unlike in previous weeks, the Bitcoin bulls experienced a tough week of trading. The resistance at $68,578 proved to be a tough nut to crack on several occasions and proved insurmountable. It is possible that the mother of all cryptos is simply gathering strength for a sustained breakout.
Bitcoin has experienced a week of volatile sideways movement. Corresponding highs and lows now serve as trigger points for further impulses. In this context, the breakout above USD 68,578 remains the trend-following preference. Accordingly, a sustained breakout above this level allows for further potential up to the round mark of USD 70,000 and beyond to the resistance level of USD 71,611, before new record levels of USD 75,000 and more become interesting.
The support level of USD 65,800, which has already been tested several times, has so far proven robust despite being temporarily breached. However, a daily close below USD 64,865 would allow further selling pressure. Subsequently, one would have to consider selling pressure down to USD 62,470 and possibly lower to USD 60,184.
.
.
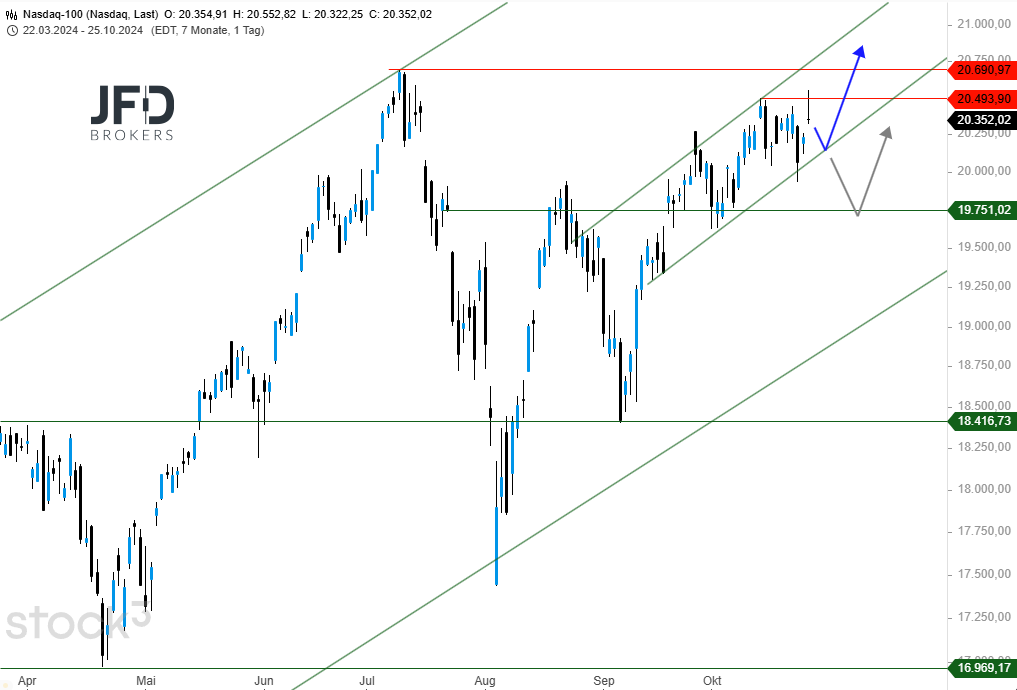
NASDAQ100 with new all-time high
.
In the last trading week, the market bulls managed to form a fresh multi-week and multi-month high. On the last trading day of the week, the US tech index rose to its highest level since 16 July. Even though the daily highs could not be maintained, the further outlook remains unclouded.
An imminent breakout to new highs seems possible at any time. In the short term, an upward trend line can be assumed on a daily chart basis, which could outline the further path. Therefore, quotations above this trend line, with a daily closing level above 20,493 points, allow a further performance to 20,691 and finally to the round mark of 21,000 points.
On the other hand, index levels below the round 20,000-point mark should be avoided. A dip below this level would likely trigger a pullback to at least 19,751 points. Below 19,630 points, further selling would open up and set the stage for drops to 19,000 and below 18,417 points.
.
.
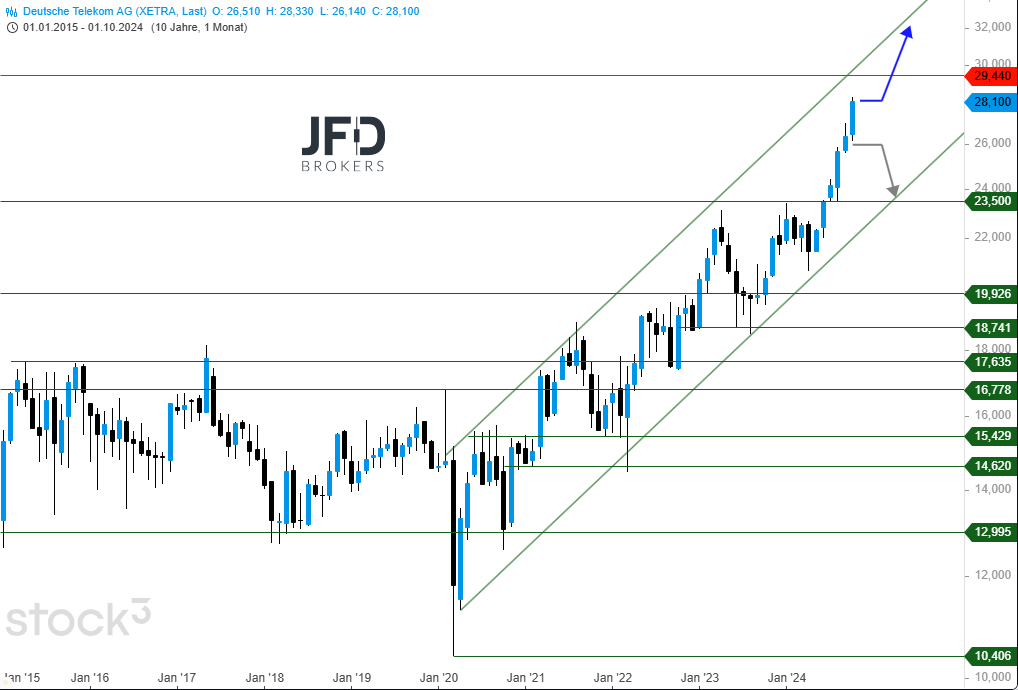
Deutsche Telekom comes to life
.
A forgotten player from the dotcom era around the turn of the millennium is increasingly coming to life. For several months now, Deutsche Telekom's share price has been continuously rising. We will now explain why a break nevertheless appears possible shortly.
Deutsche Telekom shares began their literal resurrection in the spring of 2020, at the height of the pandemic. Since then, one upward trend channel has established itself after another, with the next target at EUR 30.00 per share. On the one hand, resistance at EUR 29.44 can be derived from earlier times, and a cross-resistance zone can be defined at around EUR 30.00. Profit-taking should not come as a surprise there, although the long-term trend allows for higher prices of up to EUR 32.50 in 2025.
In order to dampen the positive trend, the current October low of EUR 26.14 would have to be breached. If this happens, further setbacks within the trend channel to the area of the lower trend line at EUR 23.50 would be conceivable.
.
.
.
Disclaimer:
The content we produce does not constitute investment advice or investment recommendation (should not be considered as such) and does not in any way constitute an invitation to acquire any financial instrument or product. The Group of Companies of JFD, its affiliates, agents, directors, officers or employees are not liable for any damages that may be caused by individual comments or statements by JFD analysts and assumes no liability with respect to the completeness and correctness of the content presented. The investor is solely responsible for the risk of his investment decisions. Accordingly, you should seek, if you consider appropriate, relevant independent professional advice on the investment considered. The analyses and comments presented do not include any consideration of your personal investment objectives, financial circumstances or needs. The content has not been prepared in accordance with the legal requirements for financial analyses and must therefore be viewed by the reader as marketing information. JFD prohibits the duplication or publication without explicit approval.
There are risks involved with trading of cash equities. Past performance is not indicative of future results. You should consider whether you can tolerate such losses before trading. Please read the full Risk Disclosure (https://www.jfdbrokers.com/en/legal/risk-disclosure).
Copyright 2024 JFD Group Ltd.