


Recently, the news hit the wires that the owner of Snapchat, Snap Inc. (NYSE: SNAP), decided to release a new feature on its platform, which will highlight viral videos. The company decided to follow Instagram and step on the toes of Tik Tok, what was applauded by investors. The news comes about a month after a decent earnings report was delivered in Q3. Snap Inc. surprised investors with an improved EPS of $-0.14, when the consensus forecast was for a $-0.18. Its net loss per year fell from $227mln to $200mln. Snap Inc. also saw an increase of daily active users by 4%, which means that in a world with very tough competition, the company continues to deliver some positive results. However, the company will still have to continue innovating, as copying the competition might not be a long-lasting successful strategy.
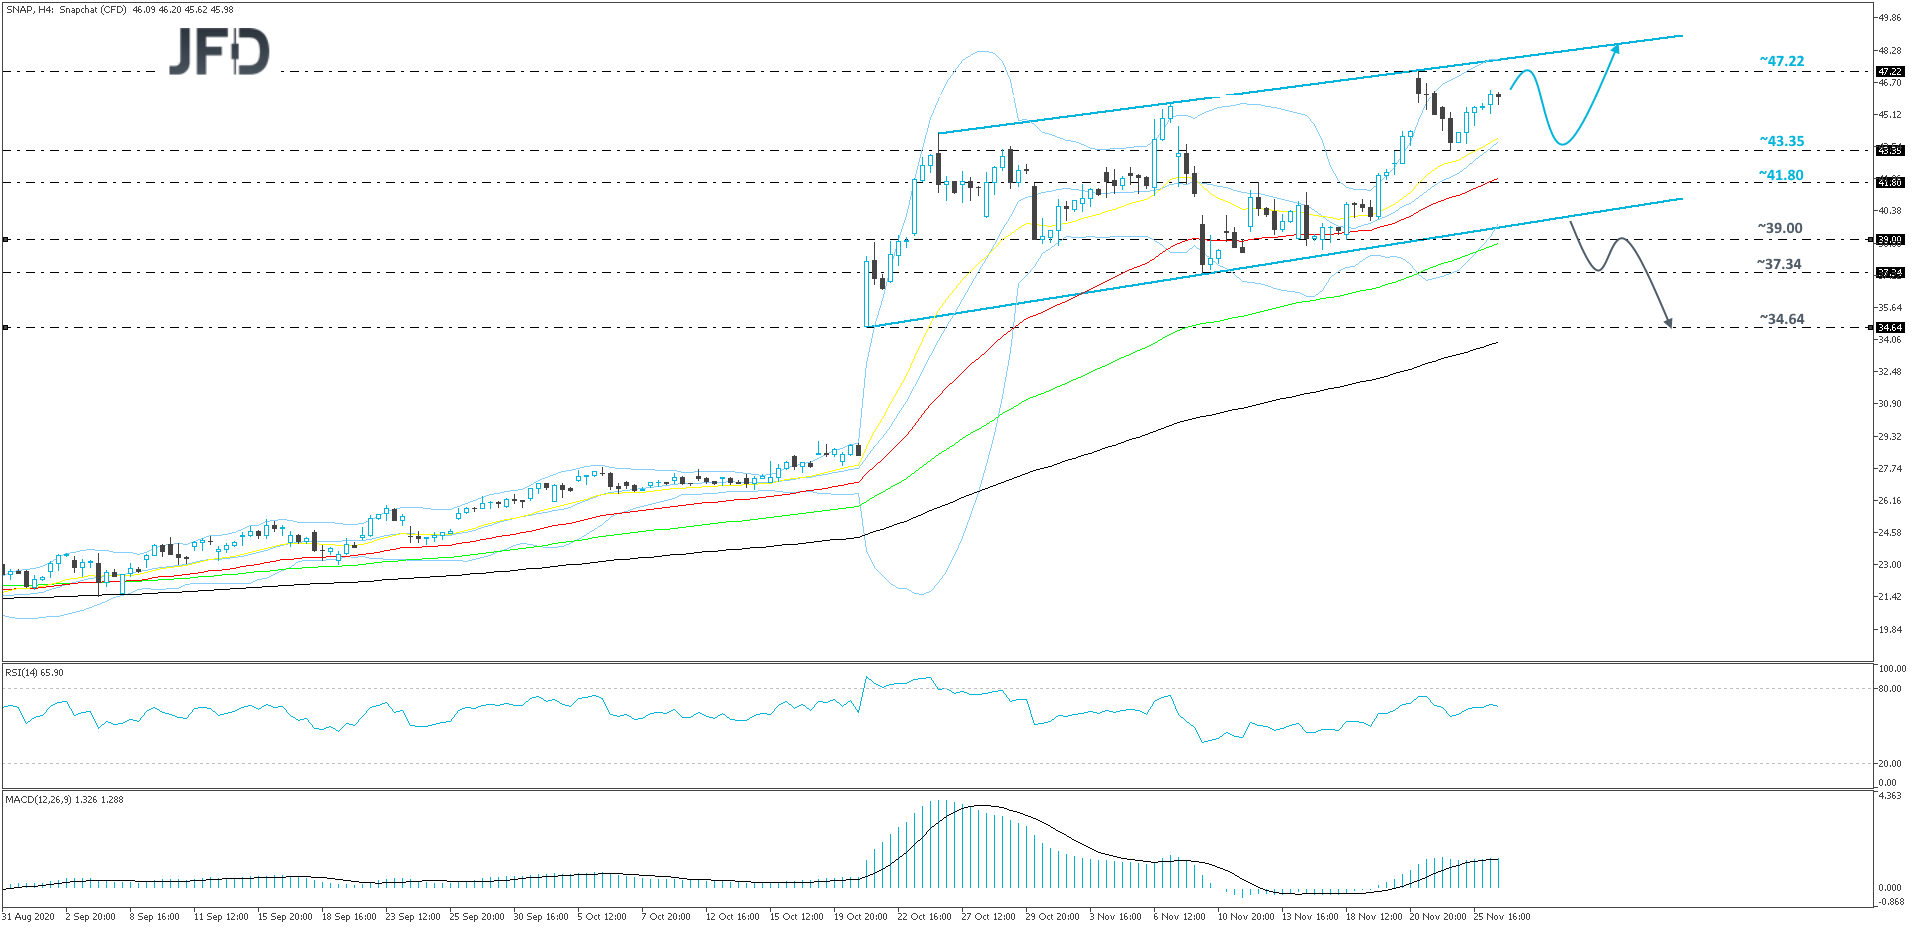
Looking at the technical picture of SNAP on our 4-hour chart, it continues to trade within a short-term rising channel, which has been in play from around the end of October. This suggests there could be more upside to come in the near future, however small setbacks are possible too, as the stock will remain vulnerable to the broader market sentiment.
If the share price gets another boost soon, it may end up testing its current all-time high, at 47.22, which if remains intact, could force the stock to correct slightly lower. If so, SNAP may drift back to the 21 EMA, or to the low of November 24th, at 43.35, where it could get halted for a bit. If that area proves to be an important support zone, new buyers might join in and drive the stock higher. A break of the 47.22 barrier and another test of the upper bound of the channel would place SNAP into uncharted territory.
The RSI and the MACD are both on the flat side. However, the RSI is above 50 still and the MACD is well above zero and is fractionally above its trigger line. The two oscillators continue to indicate positive price momentum, which supports the above-discussed scenario.
Alternatively, if SNAP exits the aforementioned channel through the lower side of it and also slides below the 39.00 hurdle, marked by the low of November 18th, that may spook new buyers from entering any time soon, as such a move could increase the stock’s chances of moving lower. We will then aim for the lowest point of November, at 37.34, a break of which might open the door for a move to the 34.64 level, marked by the low of October 21st.
Disclaimer:
The content we produce does not constitute investment advice or investment recommendation (should not be considered as such) and does not in any way constitute an invitation to acquire any financial instrument or product. The Group of Companies of JFD, its affiliates, agents, directors, officers or employees are not liable for any damages that may be caused by individual comments or statements by JFD analysts and assumes no liability with respect to the completeness and correctness of the content presented. The investor is solely responsible for the risk of his investment decisions. Accordingly, you should seek, if you consider appropriate, relevant independent professional advice on the investment considered. The analyses and comments presented do not include any consideration of your personal investment objectives, financial circumstances or needs. The content has not been prepared in accordance with the legal requirements for financial analyses and must therefore be viewed by the reader as marketing information. JFD prohibits the duplication or publication without explicit approval.
There are risks involved with trading of cash equities. Past performance is not indicative of future results. You should consider whether you can tolerate such losses before trading. Please read the full Risk Disclosure.
Copyright 2020 JFD Group Ltd.