


Global equity indices were a sea of green yesterday and today in Asia, perhaps due to strong quarterly earnings by big banks, but also due to better than expected US initial jobless claims and a slowdown in the nation’s producer prices. Today, we get the US retail sales for September, with investors eager to find out how much they were impacted by bottlenecks and high inflation.
Investors Increase Risk Exposure on Upbeat Earning sand Favorable Data
The US dollar continued trading lower against all but one of the other major currencies on Thursday and during the Asian session Friday. It lost the most ground versus NZD, CAD, and AUD in that order, while it eked out some gains only against JPY.
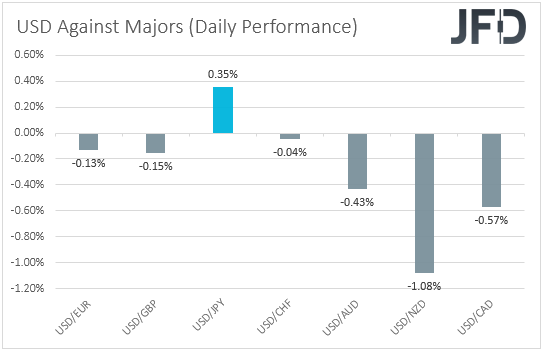
The performance in the FX world clearly points to further improvement in investors’ risk appetite and this is also evident by the performance in the equity world. Major EU and US indices soared on average 1.42% each, with the optimism, although softer, rolling into the Asian session today as well.
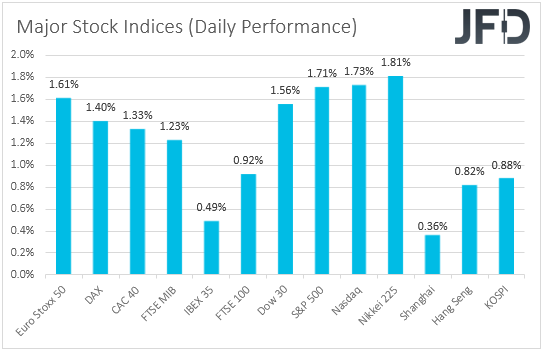
Market participants continued buying stocks, perhaps due to strong quarterly earnings by big banks, like JPMorgan Chase & Co, Citigroup, Wells Fargo & Co, and Bank of America Corp. Just for the record, all four banks reported a combined profit of USD 28.7bn for the third quarter. What’s more, US initial jobless claims fell by more than expected last week, while producer prices slowed somewhat on a monthly basis. In our view, this was a blend of developments pointing to an improving US economy, but without the fear of inflation accelerating further.
Ok, someone could argue that this is just a day’s data and that on Wednesday, the headline US CPI ticked higher. In our view, it seems that with equities already correcting decently lower, investors may have jumped back into the action due to fear of missing out. Even on Wednesday, when inflation data revealed a small acceleration, US equities were up, raising questions as to which extend an aggressive tightening by the Fed is priced in. What’s more, the PPIs, although not a major market mover, are more forward-looking indicators, as producer prices feed into future consumer prices, and thus, a slowdown may have raised some hope that the CPIs could ease somewhat in the months to come as well.
Up until yesterday, we were reluctant to turn our eyes to the upside, and we said that there was a chance for another setback in equities. In our view, with no significant change in the fundamental background, that chance is still on the table. However, with the technical pictures of several equity indices pointing to breaks above significant downside resistance lines, we will now aim higher for a while, as investors may have already accepted that the Fed will taper in November, and perhaps raise interest rates even next year. That said, we are far from trusting a long-lasting recovery. We will take things step by step, and with the first sign of weakness, we will re-evaluate.
Today, the main economic release on the agenda is the US retail sales for September. Market participants may pay close attention to this report, to see by how much bottlenecks and inflation affected sales. The consensus is for headline sales to have slid somewhat, and for core ones to have continued increasing but at a slower pace than in August. Anything better than the forecasts may suggest that the economy is faring better than many believe, despite the latest surge in inflation. This is likely to prove positive for equities, but for the US dollar as well, as it will allow Fed policymakers to proceed with their monetary policy plans. A worse than expected outcome, could have the opposite market effect.
DJIA – Technical Outlook
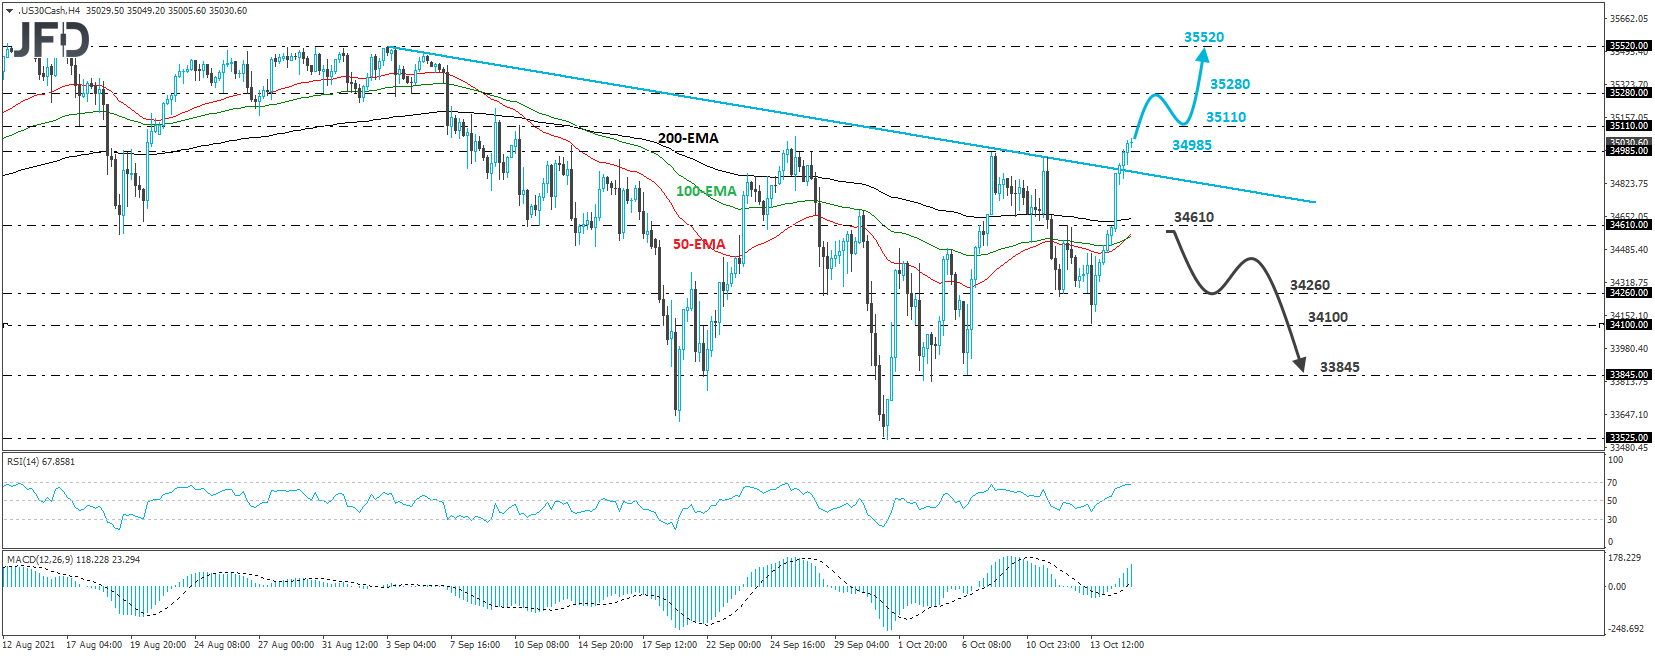
The Dow Jones Industrial Average cash index surged yesterday, breaking above the downside resistance line drawn from the high of September 3rd, as well as above the 34985 barrier, marked by the high of October 7th, thereby confirming a forthcoming higher high. In our view, this has turned the short-term picture to a positive one.
We would expect participants to challenge the 35110 level soon, marked by the high of September 10th, the break of which may extent the advance towards the 35280 area, which acted as a decent support between August 31st and September 6th. If that zone is not able to stop the bulls, then we may experience extensions towards the 35520 obstacle, which acted as a ceiling between August 25th and September 6th.
We will aim lower again, only if we see a retreat back below 34610, a support marked by the inside swing high of October 12th. This could confirm the index’s return back below the aforementioned downside line and could pave the way towards the 34260 barrier, or the 34100 hurdle, marked by the low of October 13th. Another break, below 34100 could extend the fall towards the 33845 territory, which provided support on October 4th, 5th, and 6th.
USD/JPY – Technical Outlook
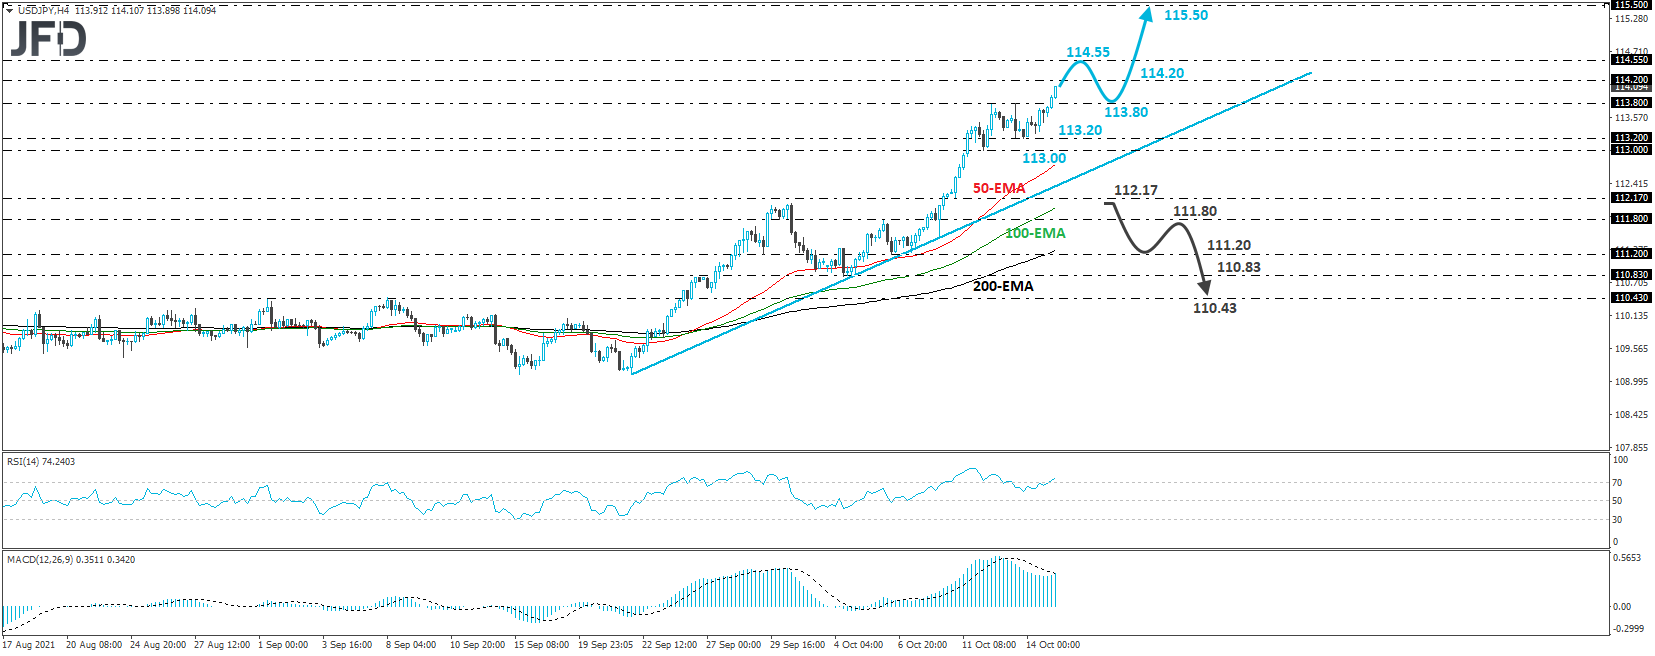
USD/JPY edged further north yesterday, and today in Asia it managed to overcome the 113.80 level, marked by Tuesday’s and Wednesday’s highs. This has confirmed a forthcoming higher high, which combined with the fact that the pair is trading above the upside support line drawn from the low of September 22nd, paints a positive near-term picture.
We believe that the bulls could soon target the 114.20 level, marked by the peak of November 12th, 2018, the break of which could extend the advance toward the peak of October 4th, 2018, at 114.55. If they don’t stop there either, we could see them climbing even higher, perhaps to the 115.50 area, marked by the high of March 10th, 2017.
The move that could signal a short-term reversal may be a dip below 112.17, in our view, a support marked by Monday’s low. This could initially target the 111.80 level, the break of which could see scope for declines towards the 111.20 or 110.83 barriers, defined as supports by the lows of October 6th and 4th, respectively. Now, if the bears are strong enough to overcome both of those obstacles, the next territory to consider may be at 110.43, marked by the inside swing high of September 8th.
As for the Rest of Today’s Events
Besides the US retail sales, the other data releases worth mentioning are the New York Empire State manufacturing index for October, as well as the preliminary UoM consumer sentiment index for the same month.
We also have one speaker on today’s schedule, and this is New York Fed President John Williams.
Disclaimer:
The content we produce does not constitute investment advice or investment recommendation (should not be considered as such) and does not in any way constitute an invitation to acquire any financial instrument or product. The Group of Companies of JFD, its affiliates, agents, directors, officers or employees are not liable for any damages that may be caused by individual comments or statements by JFD analysts and assumes no liability with respect to the completeness and correctness of the content presented. The investor is solely responsible for the risk of his investment decisions. Accordingly, you should seek, if you consider appropriate, relevant independent professional advice on the investment considered. The analyses and comments presented do not include any consideration of your personal investment objectives, financial circumstances or needs. The content has not been prepared in accordance with the legal requirements for financial analyses and must therefore be viewed by the reader as marketing information. JFD prohibits the duplication or publication without explicit approval.
CFDs are complex instruments and come with a high risk of losing money rapidly due to leverage. 73.90% of retail investor accounts lose money when trading CFDs with the Company. You should consider whether you understand how CFDs work and whether you can afford to take the high risk of losing your money. Please read the full Risk Disclosure.
Copyright 2021 JFD Group Ltd.