

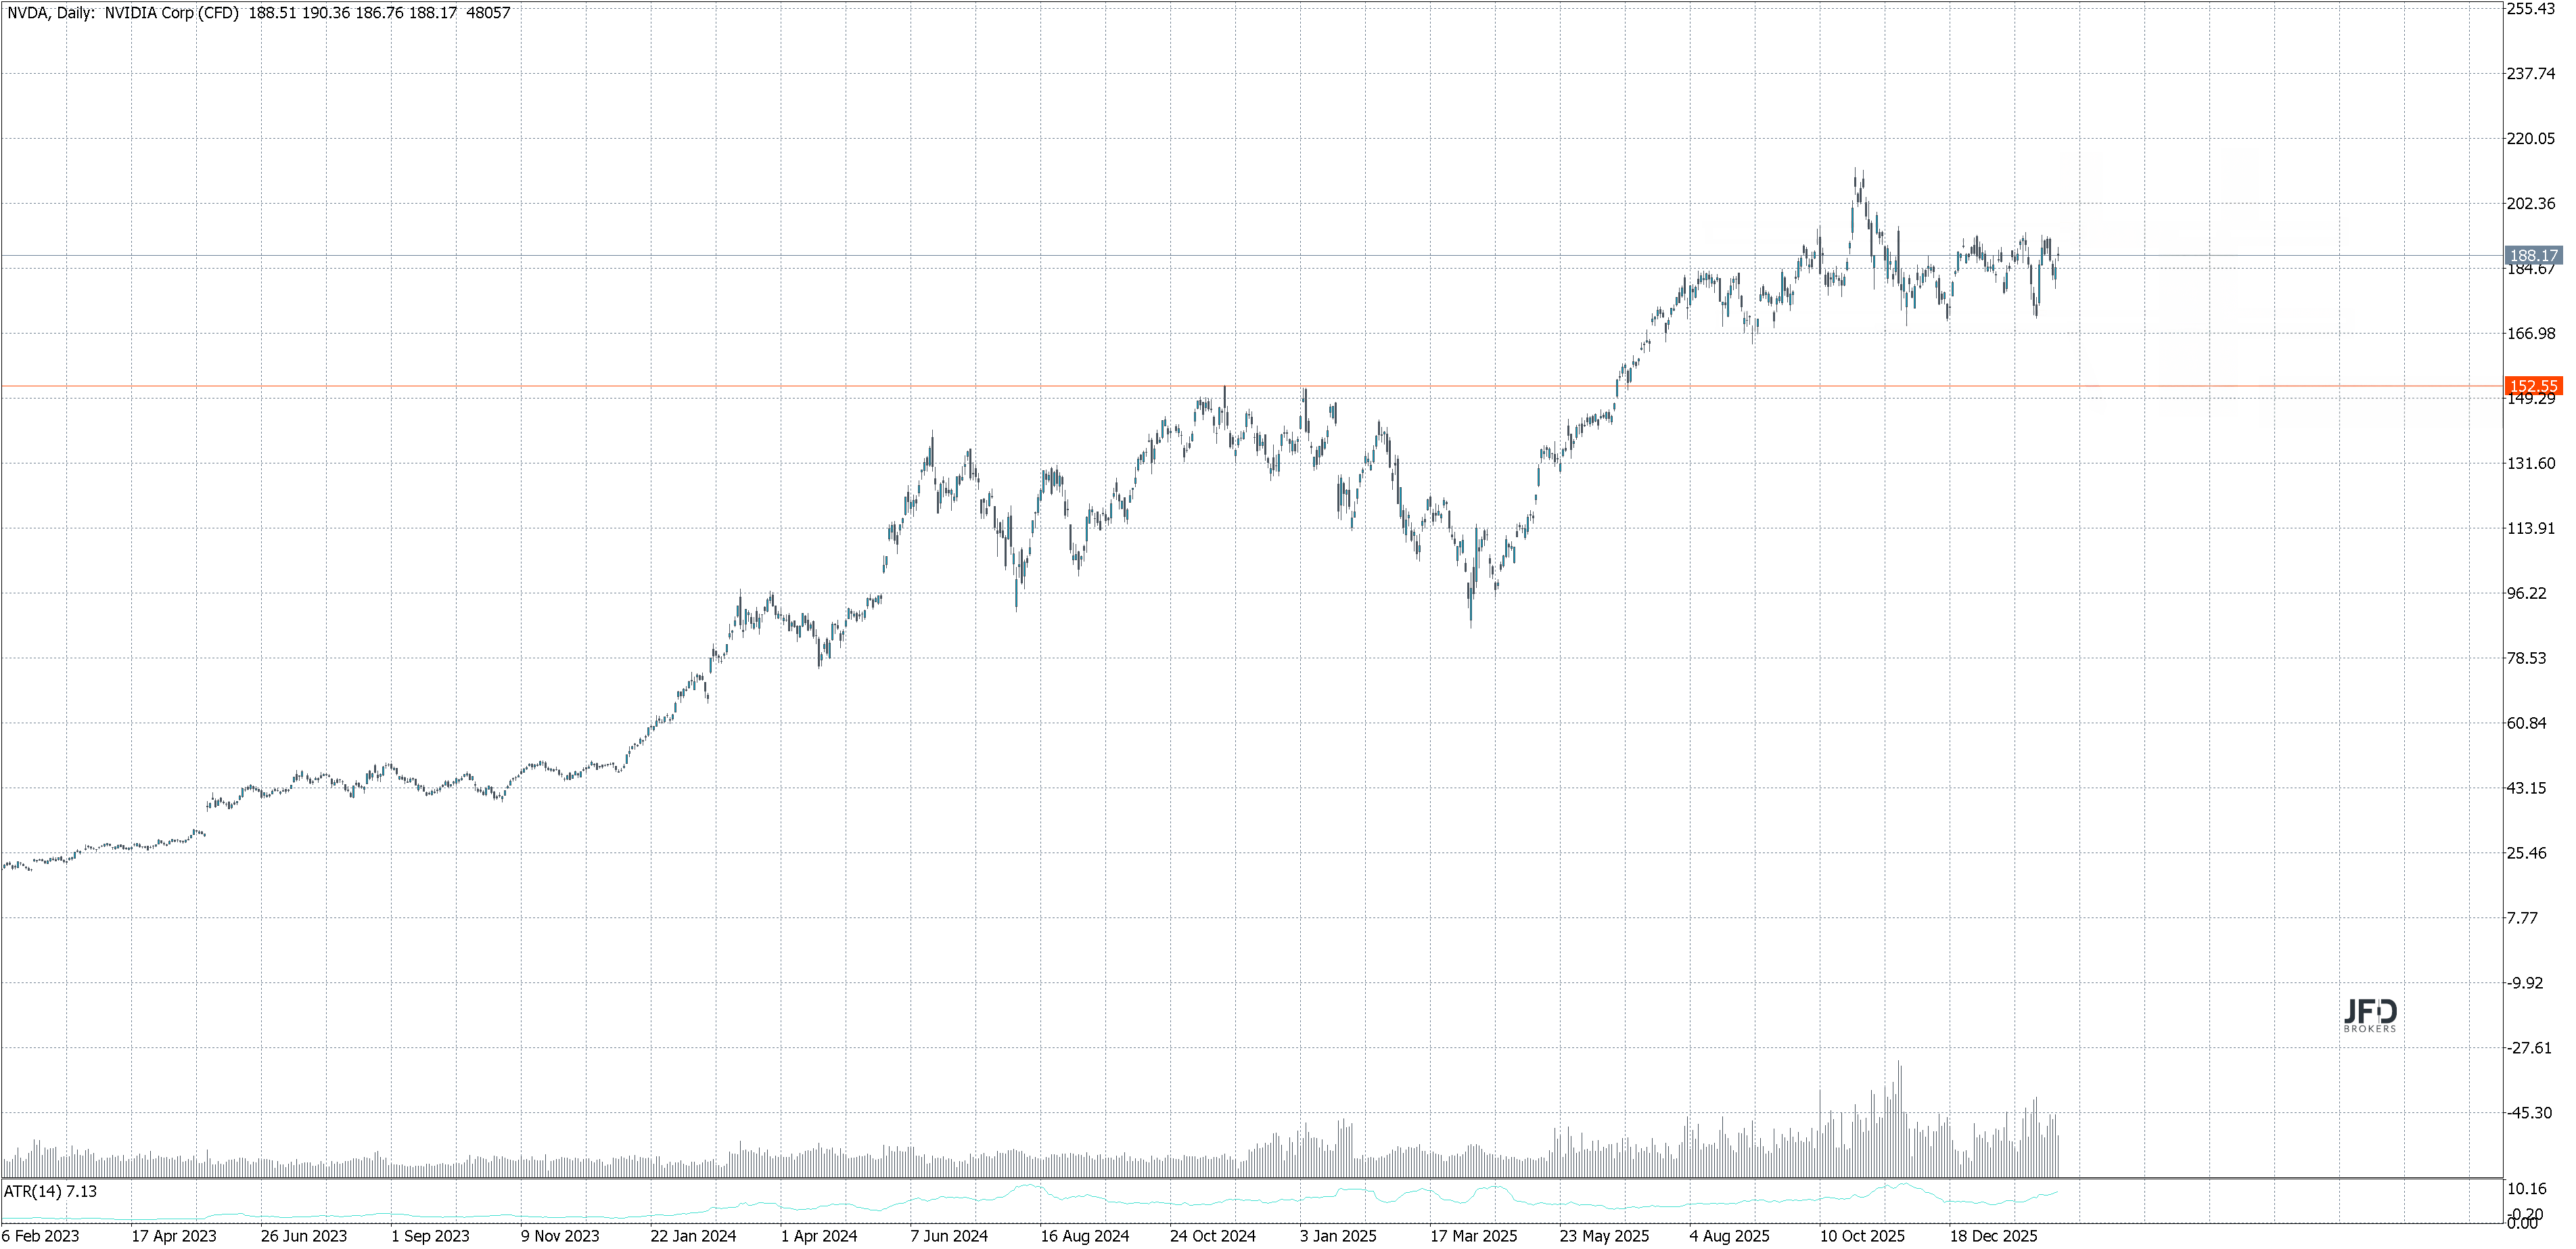
NVIDIA shares have been trading predominantly within a range between $170 and $195 for several weeks. Despite this stability, a decisive breakout has yet to occur, with price movements remaining confined within this range.
Recent pullbacks into the $170–$172 area have not resulted in extended downside movement. Price stabilized near the lower boundary range. On the upside, price has encountered resistance in the $192–$195 zone, maintaining the established range. Overall, current price action reflects consolidation rather than confirmation of a sustained directional trend.
When compared with other major semiconductor stocks, the picture remains mixed. AMD continues to trade below key resistance levels, while Qualcomm and Intel remain below previous trading levels following prior declines. Broadcom, although stabilizing, remains below earlier price levels despite recent stabilization. Against this backdrop, NVIDIA has shown comparatively more stable price movement within its current range although no decisive breakout has occurred so far.
From a broader perspective, NVIDIA continues to trade within its established range, with the $170 area currently acting as the lower boundary of that range. A sustained move above the $192–$195 zone has not yet been observed. Overall, price action reflects consolidation within this range.
The broader market context remains critical. As long as the Nasdaq 100 may influence price developments in individual semiconductor stocks, including NVIDIA. Periods of broader index weakness have historically been associated with increased volatility across individual constituents.
Overall, NVIDIA continues to trade within a defined range. Pullbacks toward the lower boundary have been followed by stabilization, while advances toward the upper boundary have met resistance. A sustained move beyond the upper boundary of the range has not yet occurred, and a move below the $170 level would represent a departure from the current range structure.
The chart is provided for illustrative purposes only and reflects hypothetical scenarios. It does not constitute a trading recommendation or investment advice.
Risk warning:
This is a marketing communication. The content is provided for informational purposes only and does not constitute investment advice, investment research, or a personal recommendation, nor should it be construed as an offer or solicitation to buy, sell, or hold any financial instrument. This communication has not been prepared in accordance with legal requirements designed to promote the independence of investment research.
The information presented does not take into account your individual investment objectives, financial situation, or needs. You should assess whether any investment is appropriate for you.
Investors are solely responsible for any investment decisions and should consider obtaining independent professional advice tailored on to their personal financial situation, investment objectives and risk tolerance before taking any investment decision. Duplication, distribution or publication of this content is prohibited without explicit approval.
59.18% of retail investor accounts lose money when trading CFDs with this provider. You should consider whether you understand how CFDs work and whether you can afford to take the high risk of losing your money.
Trading in cash equities involves risk. The value of investments may go down as well as up. Past performance is not a reliable indicator of future results. Please read the full Risk Disclosure available on our website.