


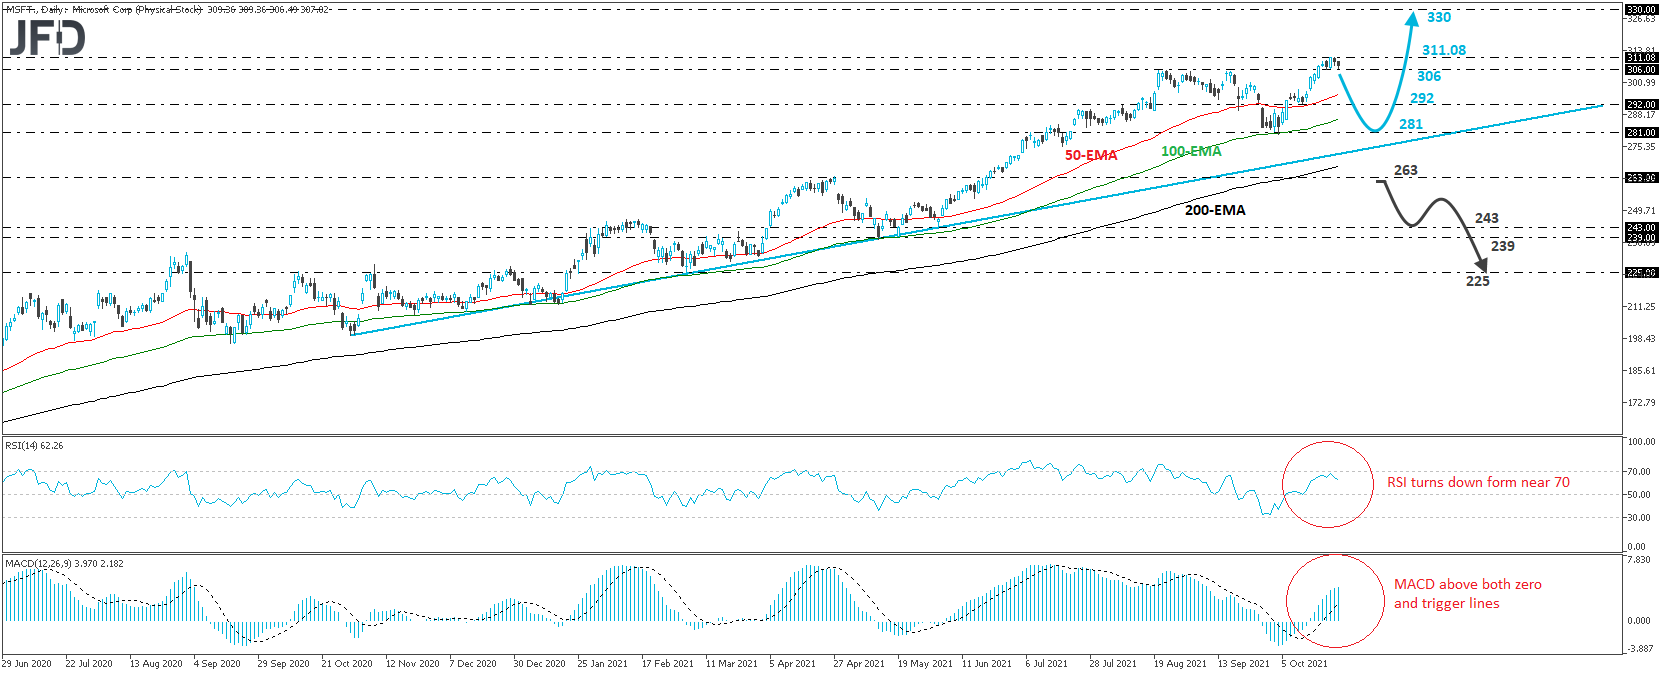
Microsoft Corp. (NASDAQ: MSFT) entered a rally mode on October 4th, when it hit support near the 281 territory, and last Thursday, it managed to hit a fresh record, at around 311.08. Then, the stock retreated somewhat. However, overall, it remains above the upside support line drawn from the low of October 30th, and this keeps the broader outlook positive.
The current retreat may continue for a while more. The stock may fall back below the peak of August 20th, at around 306, a move that could pave the way towards the 292 or 281 territories, marked by the lows of October 12th and 4th respectively. Market participants may jump back into the action from near one of those territories and perhaps aim for another test at the record of 311.08. If they are strong enough to overcome that record, we could see extensions towards the 330 zone.
Taking a look at our short-term oscillators, we see that the RSI turned down after it hit resistance near 70, while the MACD lies above both its zero and trigger lines, but shows signs of topping. Both indicators detect slowing upside speed and support the notion for some more downside correction before then next leg north.
Nevertheless, in order to start examining a bearish trend reversal, we would like to see a dip back below 263, marked by the inside swing high of April 27th. This could confirm the break below the upside support line taken from the low of October 30th, and may initially pave the way towards the low of June 3rd, at around 243, or the low of May 12th, at 239. If investors are not interested to jump into the action in neither level, then we could see the fall extending towards the low of March 4th, at 225.
Disclaimer:
The content we produce does not constitute investment advice or investment recommendation (should not be considered as such) and does not in any way constitute an invitation to acquire any financial instrument or product. The Group of Companies of JFD, its affiliates, agents, directors, officers or employees are not liable for any damages that may be caused by individual comments or statements by JFD analysts and assumes no liability with respect to the completeness and correctness of the content presented. The investor is solely responsible for the risk of his investment decisions. Accordingly, you should seek, if you consider appropriate, relevant independent professional advice on the investment considered. The analyses and comments presented do not include any consideration of your personal investment objectives, financial circumstances or needs. The content has not been prepared in accordance with the legal requirements for financial analyses and must therefore be viewed by the reader as marketing information. JFD prohibits the duplication or publication without explicit approval.
There are risks involved with trading of cash equities. Past performance is not indicative of future results. You should consider whether you can tolerate such losses before trading. Please read the full Risk Disclosure.
Copyright 2021 JFD Group Ltd.