


The market euphoria we saw the last few days was paused overnight, with Asian bourses trading in the red, as the coronavirus continued spreading at an exponential rate, with the death toll rising to 638 and the confirmed cases surging to 31485. As for today, market participants may turn their attention to the US and Canadian employment data for January, as they seek clues on how the Fed and the BoC may proceed with monetary policy in the months to come.
Risk Rally Comes to a Halt as Virus Keeps Spreading Fast
The dollar traded higher against all but two of the other G10 currencies on Thursday and during the Asian morning Friday. It gained the most against AUD, SEK, NOK, and NZD in that order, while it underperformed slightly against JPY. The greenback was found virtually unchanged against CHF.
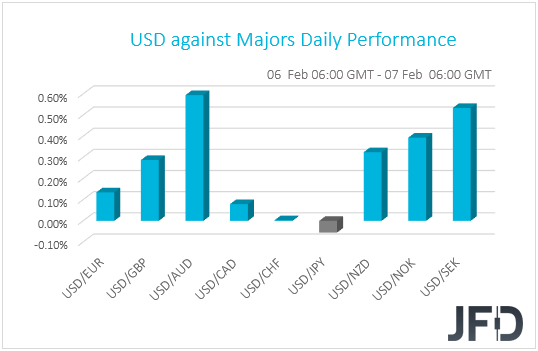
The relative strength of the safe havens JPY and CHF and the weakening of the commodity-linked AUD and NZD suggest that the latest market euphoria came to a pause at some point. Major EU and US indices continued their rally yesterday, with all three of the US ones hitting new record highs. That said, the halt came overnight, with most Asian bourses trading in the red. Although China’s Shanghai Composite gained 0.33%, Japan’s Nikkei 225 and Hong Kong’s Hang Seng slid 0.19% and 0.80% respectively.
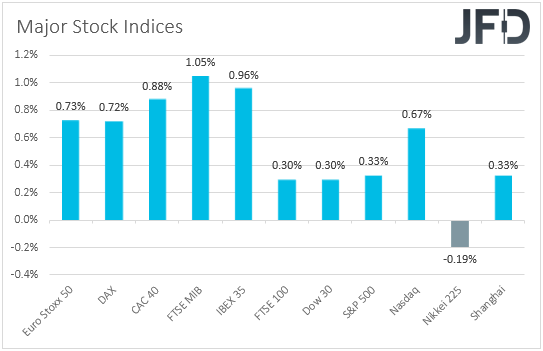
Although the latest rally was fueled by China’s policy steps to relieve pressure on its economy from the coronavirus, as well as by rumors over a cure and the nation’s actions to halve tariffs on some goods imported from the US, it still appears strange to us how easily investors have stopped being afraid of the virus’s effects. We also said that with the WHO (World Health Organization) playing down the reports over a cure, we preferred to adopt a more cautious approach, and the slide in Asian equities proves us somewhat right. Yes, EU and US indices continued cheering China’s steps, but the latest reports over how fast the virus is spreading, make us believe that the up-until-now measures may not be enough. The death toll rose to 638, with the confirmed cases of infection surging to 31485.
Thus, we stick to our guns that if the virus continues spreading at an exponential rate, incoming data may start revealing that the economic impact is larger, and may last for longer, than initially believed. Many believe that the Chinese economy will be well impacted during the first quarter of the year, but with no concrete signs that the virus could be stopped soon, the economic wounds could well drag into Q2. All this may be a reality check for investors, who could start worrying again and thereby reduce their risk exposures by diverting flows from equities, and other risk linked assets, to safe havens.
NZD/CHF – Technical Outlook
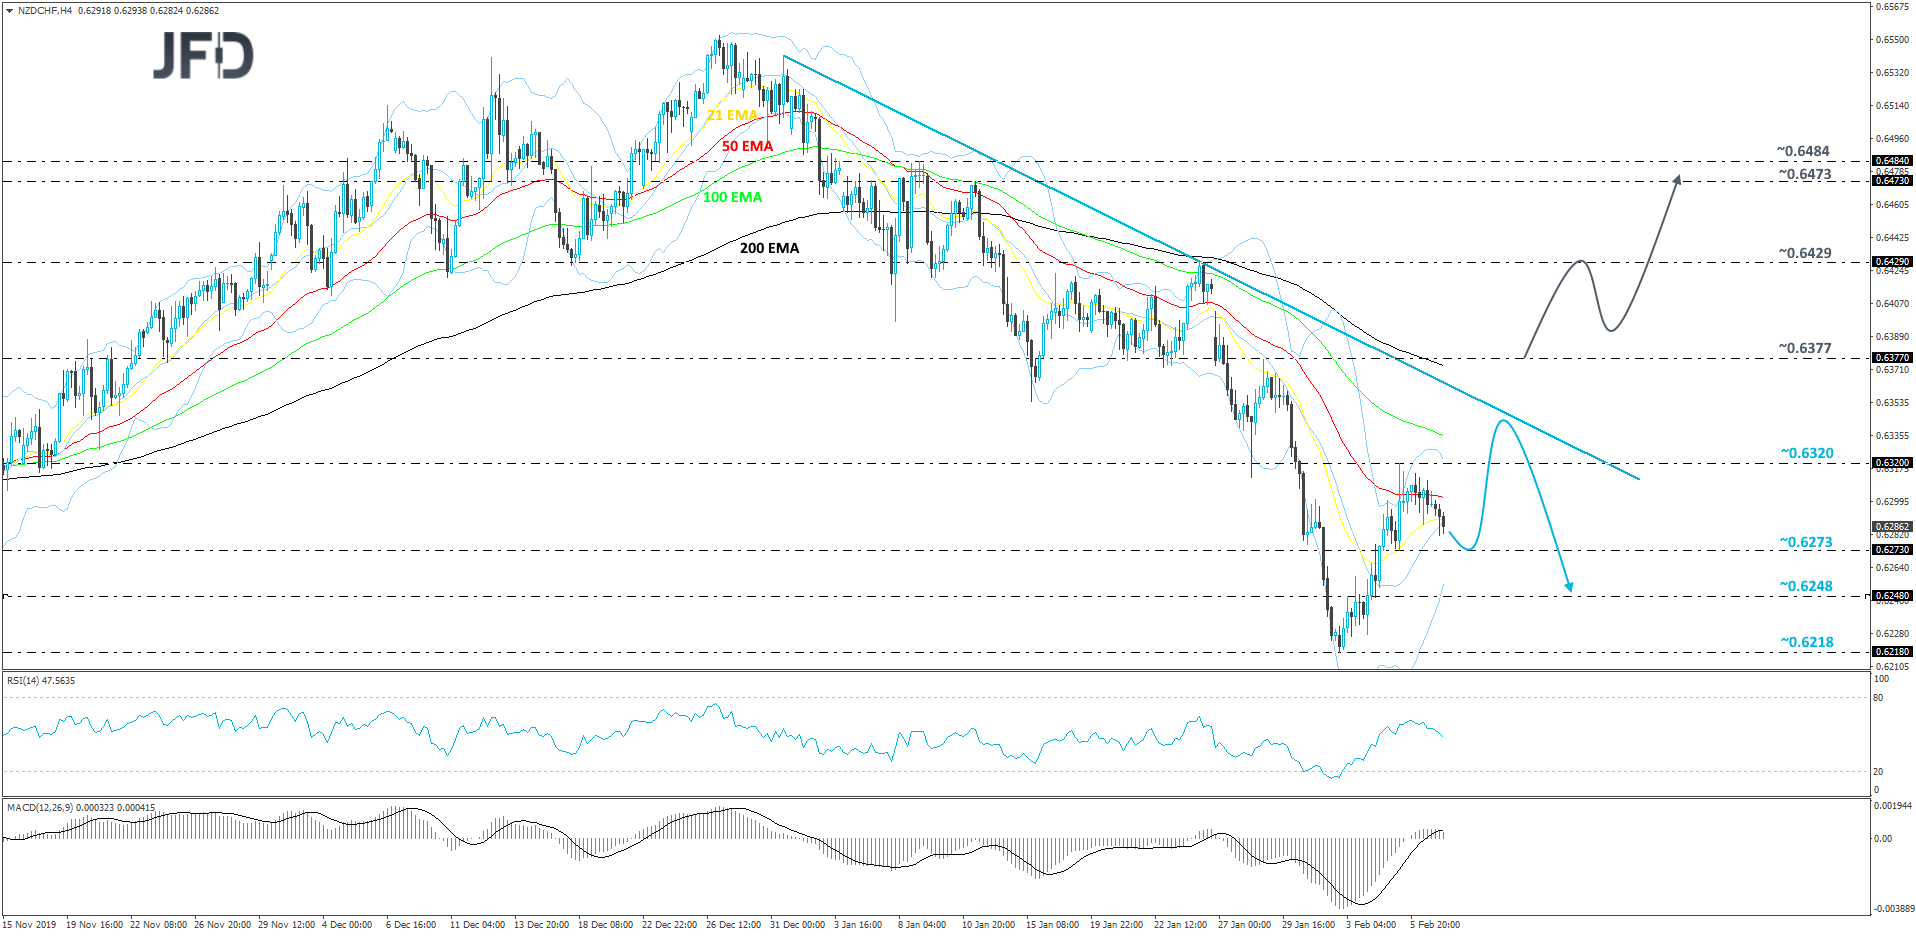
After finding support near the 0.6218 at the beginning of this week, NZD/CHF travelled upwards, in the direction of its short-term tentative downside resistance line taken from the high of December 31st. The short-term technical picture states that there still might by some room left for the pair to drift a bit higher, but if it struggles to overcome the above-discussed downside line, we may get another round of selling. This is why we will aim a bit higher for now, but overall, we will stay somewhat bearish.
Another push to the upside could bring NZD/CHF to the current high of this week, at 0.6320, which if breaks may lead the rate towards the aforementioned downside line. If the bulls find it difficult to lift the pair above that line, this might result in another round of selling, as the bears may take advantage of the higher rate. The pair could then slide back below the 0.6320 hurdle and aim for the 0.6273 zone, marked by the low of February 5th. A further decline could re-visit the area around the 0.6248 level, which is an intraday swing high of February 3rd and an intraday swing low of February 4th.
On the other hand, if the previously-discussed downside line breaks and NZD/CHF gets pushed above the 0.6377 barrier, marked by the high of January 28th, more buyers may see this is as a good opportunity to step in. Not only that the rate would be placed above the 200 EMA on the 4-hour chart, but also such activity could signal a change in the short-term trend, which might lead to some higher areas. That’s when we will aim for the 0.6429 obstacle, marked by the high of January 24th. If that doesn’t stop the bulls, its break might lead to a test of the 0.6473 or the 0.6484 levels, which are marked by the highs of January 13th and January 9th respectively.
US and Canada Employment Reports Under the Limelight
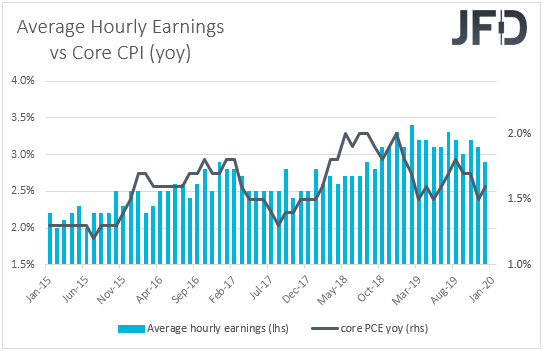
As for today, market participants may temporarily shift their attention to the US employment data for January. Nonfarm payrolls are expected to have increased 160k, more than December’s 145k, while the unemployment rate is anticipated to have held steady at its 50-year low of 3.5%. On Wednesday, the ADP report revealed that the private sector has gained 291k jobs, which may have raised speculation that the NFP number could also exceed its forecast. However, we will take that with a grain of salt, as in recent years, the ADP number has proven to be far from a reliable predictor of the NFP print. With regards to average hourly earnings, they are expected to have accelerated to +0.3% mom from +0.1%, which barring any revisions to the prior monthly prints, may drive the yoy rate a tick higher, to +3.0% from 2.9%.
Overall, the numbers point to a very decent report, but we don’t expect them to vanish expectations with regards to another rate cut by the FOMC. The message we got from the latest FOMC meeting is that policymakers are not comfortable with inflation persistently under their 2% target, and with the yoy core PCE rate, which is the Fed’s favorite inflation metric, staying below that objective since December 2018, they may start thinking about rate cuts again if this continues for more. Yes, higher earnings could be translated into higher inflation in the months to come, but with the PCE rate standing at +1.6%, we see the case of it hitting 2% soon as a hard task.
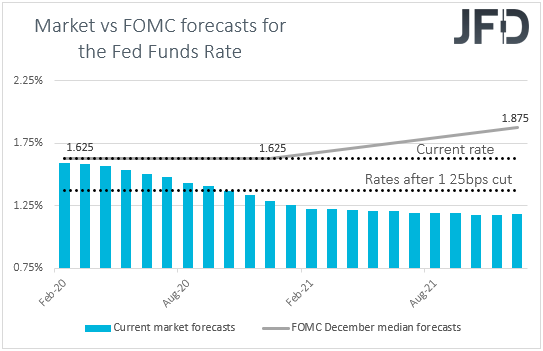
Having all these in mind, as well as the improvement in the ISM PMIs for January, we believe that solid employment numbers could just encourage investors to push further back the timing of when they expect the Fed to deliver another rate decrease, which could still prove positive for the dollar. According to the Fed funds futures, such a move is fully priced in for September.
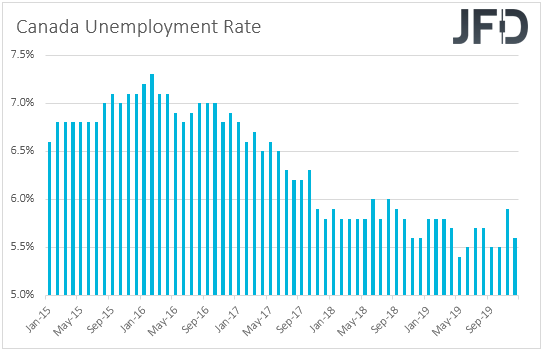
We get jobs data for January from Canada as well. The unemployment rate is expected to have held steady at 5.6%, while the net change in employment is forecast to show that the economy added 15.0k jobs, less than the 35.2k in December. At its previous gathering, the BoC removed from the statement the part saying that it is appropriate to maintain the current level of interest rates, and instead noted that “In determining the future path for the Bank's policy interest rate, Governing Council will be watching closely to see if the recent slowdown in growth is more persistent than forecast”. This means that officials have opened the door to a rate cut, with Governor Poloz confirming that at the press conference following the decision. Thus, the aforementioned jobs forecasts suggest that the door for a potential decrease in the upcoming months is likely to stay open, something that may keep the Loonie under selling interest.
USD/CAD – Technical Outlook
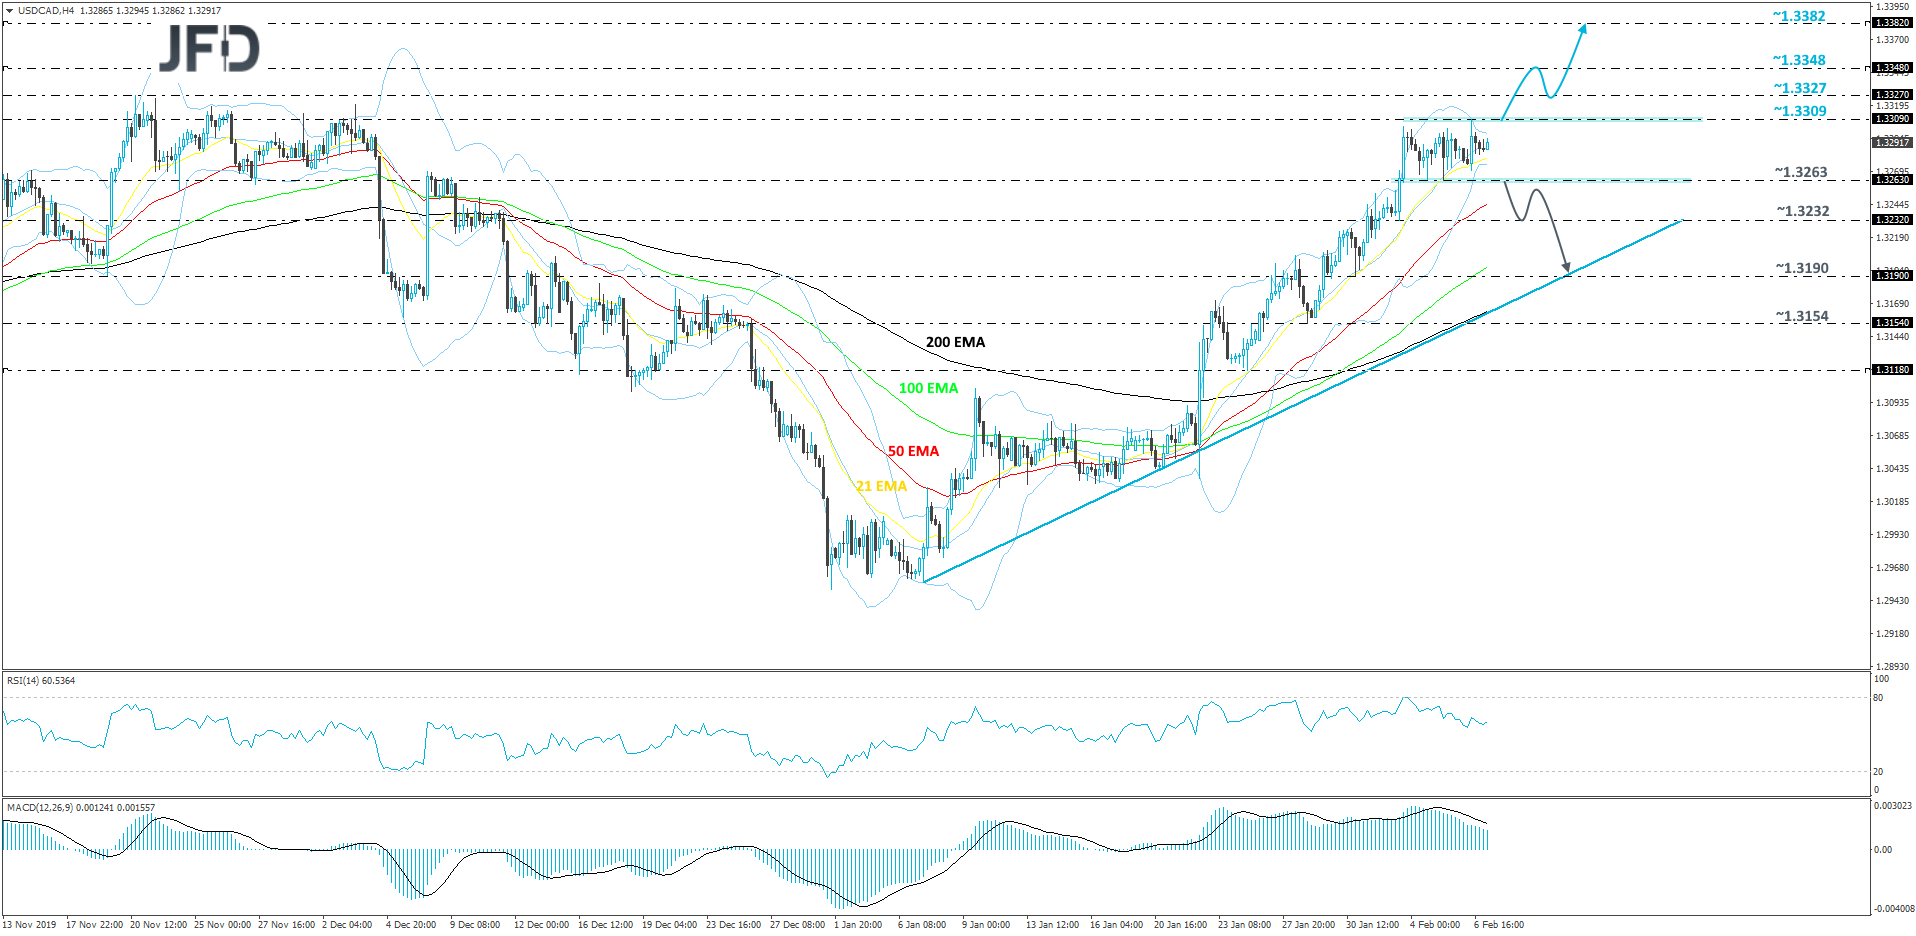
For about a month now, USD/CAD has been on a steep uprise, trading above its short-term tentative upside support line taken from the low of January 7th. This week, we are seeing a bit of sideways activity, where the rate keeps moving between the 1.3263 and 1.3309 levels. Thus, in order to continue examining the upside, at least in the short run, we would like to see a break of the upper side of that little range, at 1.3309. Hence our cautiously-bullish approach for now.
If, eventually, we do get a strong break above the 1.3309 barrier, this would confirm a forthcoming higher high and more buyers could start joining the action. We will then aim for the 1.3327 hurdle, which is the highest point of November. Slightly above it lies another potential resistance area that could get tested, at 1.3348, marked by the highest point of October. The rate may stall there, or even correct back down a bit. That said, if it remains above 1.3309 zone, this could lead to another round of buying. If so, a further move north may bring the pair to the highest point of September, at 1.3382, which might stall USD/CAD for a while.
Alternatively, from the near-term perspective, if the rate suddenly falls below the lower end of the aforementioned small range, at 1.3263, this could temporarily spook the bulls from the field and allow the bears to dictate the rules for some time. That’s when we may see a deeper move lower towards the 1.3232, a break of which may set the stage for a test of the 1.3190 level, marked by the low of January 30th, or a test of the previously-mentioned upside line, which might provide some additional support. However, let’s not forget that this move lower could still be seen as a temporary correction before another leg of buying, if that upside line stays intact.
As for the Rest of Today’s Events
During the early European morning, we already got Norway’s GDP for Q4, with the mainland qoq rate slowing to +0.2% from +0.6%. Later in the day, apart for Canada’s employment data, we also get the nation’s Ivey PMI for January, which is forecast to have risen to 53.3 from 51.9.
Disclaimer:
The content we produce does not constitute investment advice or investment recommendation (should not be considered as such) and does not in any way constitute an invitation to acquire any financial instrument or product. The Group of Companies of JFD, its affiliates, agents, directors, officers or employees are not liable for any damages that may be caused by individual comments or statements by JFD analysts and assumes no liability with respect to the completeness and correctness of the content presented. The investor is solely responsible for the risk of his investment decisions. Accordingly, you should seek, if you consider appropriate, relevant independent professional advice on the investment considered. The analyses and comments presented do not include any consideration of your personal investment objectives, financial circumstances or needs. The content has not been prepared in accordance with the legal requirements for financial analyses and must therefore be viewed by the reader as marketing information. JFD prohibits the duplication or publication without explicit approval.
CFDs are complex instruments and come with a high risk of losing money rapidly due to leverage. 76% of retail investor accounts lose money when trading CFDs with the Company. You should consider whether you understand how CFDs work and whether you can afford to take the high risk of losing your money. Please read the full Risk Disclosure.
Copyright 2020 JFD Group Ltd.