

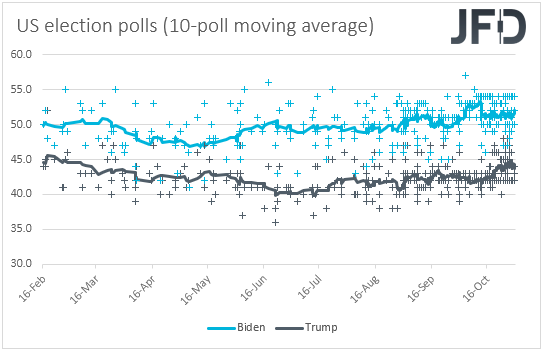
And the day has come. Today is the last day American citizens have to cast their ballots with regards to their candidate of preference for the position of the US President. According to opinion polls, Biden is leading Trump by around 10 percentage points, but the contest in battleground states is much tighter. Today, we discuss the effect each possible outcome could have on the financial markets.
How Can the Election Outcome Affect the Financial World?
The US dollar traded lower against the majority of the other G10 currencies on Monday and during the Asian morning Tuesday. It underperformed the most against CAD, AUD, and NZD in that order, while it gained some ground only versus CHF. The greenback was found virtually unchanged against JPY and SEK.
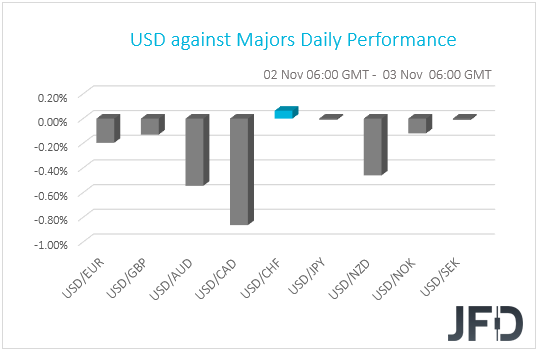
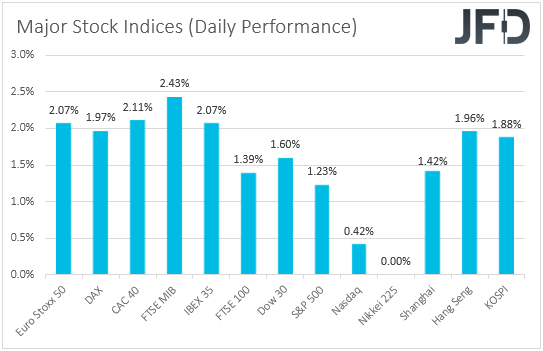
The strengthening of the commodity-linked Loonie, Aussie and Kiwi, combined with the weakness in the safe-havens dollar, yen and franc, suggests that markets traded in a risk-on fashion just a day ahead of the US elections. Indeed, major EU and US indices were a sea of green yesterday, with the positive appetite rolling into the Asian session today.
As we already noted, today, the spotlight is likely to fall on the US presidential elections. According to national polls, the Democratic candidate Joe Biden is leading incumbent President Donald Trump by around 10 percentage points. That said, the contest is much tighter in battleground states that could decide the outcome.
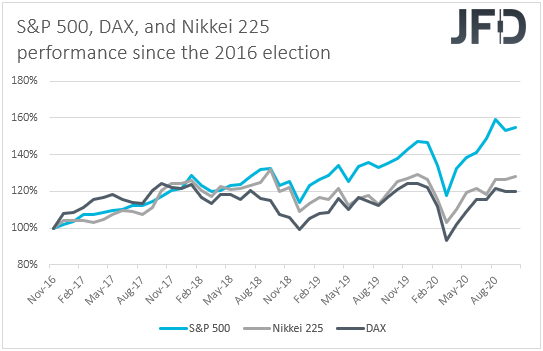
So, what are market participants looking in each candidate and what impact the election result could have in the financial world? President Donald Trump has pledged to keep the 2017 corporate tax cuts in place, which could prove positive for US equities. The opposite may be true if Biden wins, as the Democratic candidate has called for an increase in taxes on corporations and high-income individuals. However, Biden’s spending plans are unlikely to allow a major trend reversal. Perhaps we’ll get a correction before the prevailing uptrend’s revival. Stocks in the rest of the world may not react in a similar fashion as the US ones. A Trump re-election may result in more trade frictions between the US and other nations, especially China, and thus, equities outside the US may retreat in case Trump keeps his throne. Biden is expected to adopt a softer stance on trade, which means that global equities may gain if he is victorious, even if US indices retreat somewhat. In the graph below, we can clearly see that US stocks performed much better than their European and Asian counterparts during Trump’s term.
In the FX world, a Biden victory may result in a slide in the US dollar. Both candidates are expected to push for more infrastructure spending, but Biden’s agenda is looser, which combined with an extra-accommodative Fed may result in some dollar selling. The yen and other safe havens could also slide on expectations of a better handling of international trade relations, while the commodity-linked Aussie and Kiwi could strengthen. The opposite may be true if Trump gets re-elected. Now, in case we get an extended period of uncertainty, due to either delays in announcing a winner, or even a contested election (Trump said that he may not accept a defeat as mail-in balloting could lead to voter fraud), risk assets around the globe may suffer as investors seek shelter in safe havens until we have a clear outcome.
Having said all that, the market reaction may also depend on which party will gain majority in US Congress. The Congress consists of two chambers: The House of Representatives and the Senate. Currently, Democrats hold the majority in the House, while the Senate is controlled by the Republicans. Whoever gets elected, a failure of his party to take full control of the Congress may result in a more modest market reaction, as he may not be able to push through with his agenda. For example, if Biden is elected, but fails to flip the Senate, stock markets may not slide that much, on expectations that Republicans may veto his decision of increasing corporate taxes. Republicans may also oppose his spending agenda, which means a softer slide in the dollar than otherwise.
Ahead of the US election, during the Asian morning today, we had an RBA monetary policy decision. As was widely expected, policymakers of this Bank cut interest rates to 0.10% from 0.25% and decided to extend their government bond buying program by AUD 100bn to buy bonds of 5 to 10 years maturity. The Australian dollar slid only around 25 pips against the US dollar on the announcement, staying among the major gainers in the G10 sphere. In our view, the reason why the Aussie was not hurt much is because the policy actions were largely anticipated, and perhaps because Governor Lowe noted that a negative policy rate is “extraordinarily unlikely”. All this means that officials are not willing to cut rates further, and if more is needed, they could boost their bond purchases. For now, Aussie traders are likely to turn their attention to the US elections, with the currency’s reaction scenarios already outlined above.
DJIA – Technical Outlook
After the strong decline, which we saw last week, yesterday, the DJIA index managed to recover a decent amount of losses. The price tested the area near the 26065 zone on Friday, but today, the cash index is back above the 200-day EMA and the 27000 mark. Although we are currently experiencing a good recovery, we will class this move higher as a temporary correction, because DJIA is still trading below a short-term tentative downside resistance line drawn from the high of October 19th.
A further push north could bring the price closer to the 27652 hurdle and the aforementioned downside line. If that whole area is able to somehow provide a descent hold-up, this may result in another slide, as the bears might take advantage of the higher price. DJIA could then travel back to the 200-day EMA, or fall further to the 26538 hurdle, marked by the lowest point of September. If that is just seen as a temporary obstacle for the sellers, the next potential target might be at 26065, which is the lowest point of last week.
Alternatively, if the previously-discussed downside line does get broken, this could clear the path towards slightly higher areas. DJIA might then travel to the 28000 zone, or the 28152 hurdle, marked by the lows of October 15th, 19th, 20th and 23rd. If the buying doesn’t end there, the next possible target may be at 28492, marked by the high of October 23rd, or somewhere near another short-term tentative downside line. That line is drawn from the high of September 3rd, which could also provide additional resistance.
![]()
EUR/USD – Technical Outlook
Yesterday, EUR/USD came close to testing the lowest point of September, at 1.1610, which is currently seen as an important area of support. This morning, the pair is going for a bit of recovery, given that we saw sharp decline last week. Also, let’s not forget that the rate continues to trade below a short-term tentative downside line, drawn from the high of September 1st. Although we may see a bit more movement to the upside, we will still consider this move as a corrective one, before another possible leg of selling.
A small push higher could bring the rate to the 100-day EMA, or to the low of October 15th, at 1.1688, where the pair might stall for a bit. If the bulls find it hard to overcome that whole resistance area, this might invite the bears back into the game. If so, EUR/USD could end up sliding again, potentially aiming for the lowest point of September, at 1.1610. If that area surrenders, this would confirm a forthcoming lower low, possibly opening the door for a move to the 1.1495 level, marked by the highest point of March.
In order to consider the upside scenario, we would like to wait for a violation of the aforementioned downside line. If that occurs, EUR/USD may end up rising to the 1.1880 obstacle, or the 1.1918 hurdle, marked by the highs of October 21st and September 10th. If the bulls are still feeling comfortable, the next potential resistance target could be at 1.2010, which is the highest point of September.
![]()
As for the Rest of Today’s Events
Even though all eyes will be on the US presidential election, there are some indicators worth mentioning due to be released ahead of a potential final outcome. Those are the US factory orders for September, and the API (American Petroleum Institute) report on crude oil inventories for last week. Factory orders are expected to have accelerated to +1.0% mom from +0.7% in August, while, as it is always the case, no forecast is available for the API print.
As for tonight, during the Asian session Wednesday, we get New Zealand’s employment report and Australia’s retail sales, both for Q3. New Zealand’s unemployment rate is forecast to have risen to 5.4% from 4.0%, while the net change in employment is expected to show that the economy has lost 0.8% jobs after losing 0.4% in Q2. The labor cost index is expected to have slowed to +1.5% yoy from +1.8%. Australia’s retail sales are expected to have rebounded 6.0% qoq after falling 3.4%.
Disclaimer:
The content we produce does not constitute investment advice or investment recommendation (should not be considered as such) and does not in any way constitute an invitation to acquire any financial instrument or product. The Group of Companies of JFD, its affiliates, agents, directors, officers or employees are not liable for any damages that may be caused by individual comments or statements by JFD analysts and assumes no liability with respect to the completeness and correctness of the content presented. The investor is solely responsible for the risk of his investment decisions. Accordingly, you should seek, if you consider appropriate, relevant independent professional advice on the investment considered. The analyses and comments presented do not include any consideration of your personal investment objectives, financial circumstances or needs. The content has not been prepared in accordance with the legal requirements for financial analyses and must therefore be viewed by the reader as marketing information. JFD prohibits the duplication or publication without explicit approval.
CFDs are complex instruments and come with a high risk of losing money rapidly due to leverage. 72.57% of retail investor accounts lose money when trading CFDs with the Company. You should consider whether you understand how CFDs work and whether you can afford to take the high risk of losing your money. Please read the full Risk Disclosure.
Copyright 2020 JFD Group Ltd.