

Although the dollar continued trading lower against most of the other G10 currencies, EU and Asian stocks traded in negative water, as US-China tensions escalated further. The US announced it will close China’s consulate in Houston, with China considering retaliating by closing the US consulate in Wuhan.
Equities Reverse South as US-China Tensions Escalate
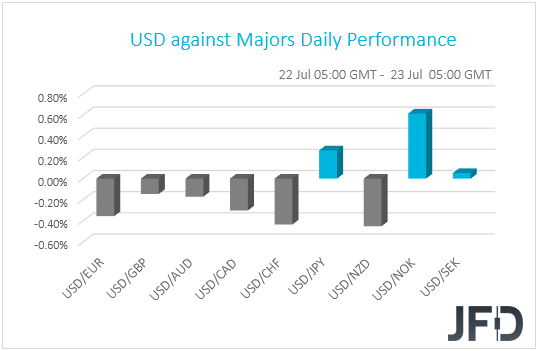
The US dollar continued trading lower against the majority of the other G10 currencies on Wednesday and during the Asian morning Thursday. It lost the most ground against NZD, CHF, and EUR, while it gained only versus NOK and JPY. The greenback was found virtually unchanged against SEK.
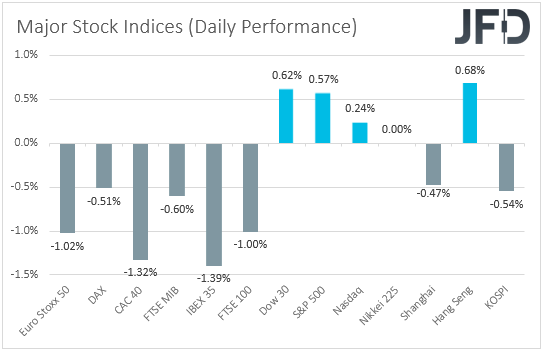
The weakening of the dollar and the yen, combined with the strengthening of the Kiwi, suggests that market sentiment remained supported for another day. However, the fact that the Swiss franc was among the main gainers points otherwise. Thus, in order to clear things up, we prefer to turn our gaze to the equity world. There, major EU indices traded in negative territory, but the US ones managed to close positive. The negative sentiment returned during the Asian session today. Although Hong Kong’s Hang Seng gained 0.68%, China’s Shanghai Composite and South Korea’s KOSPI are down 0.47% and 0.54% respectively. Japanese markets were closed due to the Marine Day holiday.
What forced investors to reduce their risk exposure during the EU session may have been new tensions between the US and China. The US gave China until tomorrow to close its consulate in Houston amid accusations of spying, while, according to sources, China is considering retaliating by closing the US consulate in Wuhan. Investors’ morale improved somewhat during the US session, perhaps due to reports saying that the US government is willing to pay nearly USD 2bn for 100mn doses of the vaccine developed by Pfizer Inc and BioNTech SE, if it proves to be safe and effective. In any case, fears over the US-China relationship returned during the Asian trading, with the new record in daily coronavirus cases around the globe adding extra pressure.
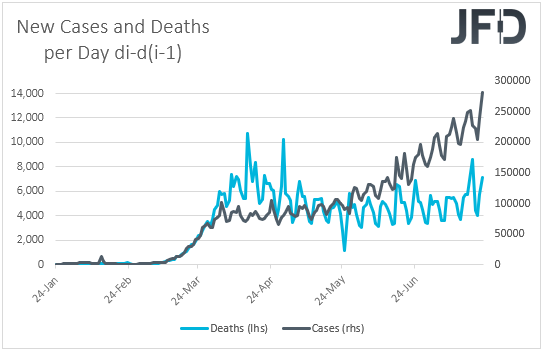
In our view, news and headlines suggesting progress in the development of a potential vaccine, combined with data suggesting that the adopted monetary and fiscal stimulus is having the desired effect, are keeping the overall recovery in equity markets intact. However, the tensions between the world’s two largest economies and the fact that infections from the coronavirus are still in acceleration mode, are resulting in downside corrections. Although we see the case for risk-linked assets to rebound again soon and continue trending north, the big question is: For how long can this pattern continue? In other words, for how long can the bulls hold onto the driver’s seat? If the US-China tensions continue to escalate and the virus continues to spread fast, investors may eventually decide to abandon equities and other risky assets, on fears of a fresh economic downturn.
DJIA – Technical Outlook
It looks like the psychological 27000 area continues to hold DJIA from pushing further north. The index keeps on flirting with that resistance zone, while balancing above a short-term tentative upside support line drawn from the low of July 10th. For now, we will remain somewhat positive with the near-term outlook, however, to get a bit more comfortable with larger extensions to the upside, a break above the 27035 barrier would be needed.
A push above the current highest point of this week, at 27035, would confirm a forthcoming higher high, this way possibly attracting some more buying interest. DJIA could then travel to the current highest point of July, at 27493, a break of which might set the stage for a push to the 27493 level, marked by the high of June 10th. Slightly above it, sits another potential resistance zone, at 27631, which is the highest point of June.
On the other hand, if the index suddenly reverses south, breaks the aforementioned upside line and falls below the current lowest point of this week, at 26637, that may spook the buyers from the field temporarily. Such a move might signal a change in the current short-term uptrend and could increase the selling activity even more. The price may then fall to the 26442 zone, or even to the 26240 territory, marked by an intraday swing high of July 14th. If the slide continues, the next potential support area could be near the 25993 level, which is the low of July 14th.
![]()
NZD/USD – Technical Outlook
NZD/USD continues to move higher this week, while trading above its short-term tentative upside support line taken from the low of June 30th. Although the rate has already distanced itself quite a bit from that upside line, the pair is showing willingness to move further north. However, to get a bit more excited about higher areas, a break above yesterday’s high would be needed. This is why we will take a somewhat-bullish approach for now.
If the acceleration continues and the rate climbs above 0.6689 barrier, which is yesterday’s high, that will confirm a forthcoming higher high and may open the door towards higher areas. More buyers could join in, this way lifting NZD/USD to its next possible obstacle, at 0.6714, a break of which might clear the way to the 0.6740 level, marked by the current highest point of 2020.
Alternatively, if the 0.6689 barrier is too much to handle for the bulls at this time and instead, the pair falls back below the 0.6644 hurdle, marked by an intraday swing low from yesterday, that could lead to a larger correction lower. NZD/USD might then travel to the 0.6632 zone, which if fails to provide support and breaks, may send the rate further down, potentially aiming for the 0.6600 level, marked by the high of July 9th. Slightly below it runs the aforementioned upside line, which could provide additional support.
![]()
As for Today’s Events
As every Thursday, we get the US initial jobless claims for last week. The forecast suggests that another 1.3mn people signed for unemployment benefits, the same number as the week before. With the slowdown in claims showing signs of a halt, this may raise concerns over the pace of the economic recovery in the US. That said, with less than two weeks to go before the extended unemployment aid for millions of Americans expires, this week, the main development in the US may be the debate in Congress over a new coronavirus-aid bill. As we noted yesterday, House Speaker Nancy Pelosi said on Tuesday that the USD 1trln package proposed by the Republicans is not sufficient, and thus, it may need a final decision above that number to refuel the latest rally in equities.
Tonight, during the Asian morning Friday, New Zealand’s trade balance for June is coming out, but no forecast is available.
As for the speakers, we have two on today’s agenda: ECB Vice President Luis de Guindos and BoE MPC member Jonathan Haskel.
The content we produce does not constitute investment advice or investment recommendation (should not be considered as such) and does not in any way constitute an invitation to acquire any financial instrument or product. The Group of Companies of JFD, its affiliates, agents, directors, officers or employees are not liable for any damages that may be caused by individual comments or statements by JFD analysts and assumes no liability with respect to the completeness and correctness of the content presented. The investor is solely responsible for the risk of his investment decisions. Accordingly, you should seek, if you consider appropriate, relevant independent professional advice on the investment considered. The analyses and comments presented do not include any consideration of your personal investment objectives, financial circumstances or needs. The content has not been prepared in accordance with the legal requirements for financial analyses and must therefore be viewed by the reader as marketing information. JFD prohibits the duplication or publication without explicit approval.
CFDs are complex instruments and come with a high risk of losing money rapidly due to leverage. 83% of retail investor accounts lose money when trading CFDs with the Company. You should consider whether you understand how CFDs work and whether you can afford to take the high risk of losing your money. Please read the full Risk Disclosure.
Copyright 2020 JFD Group Ltd.