


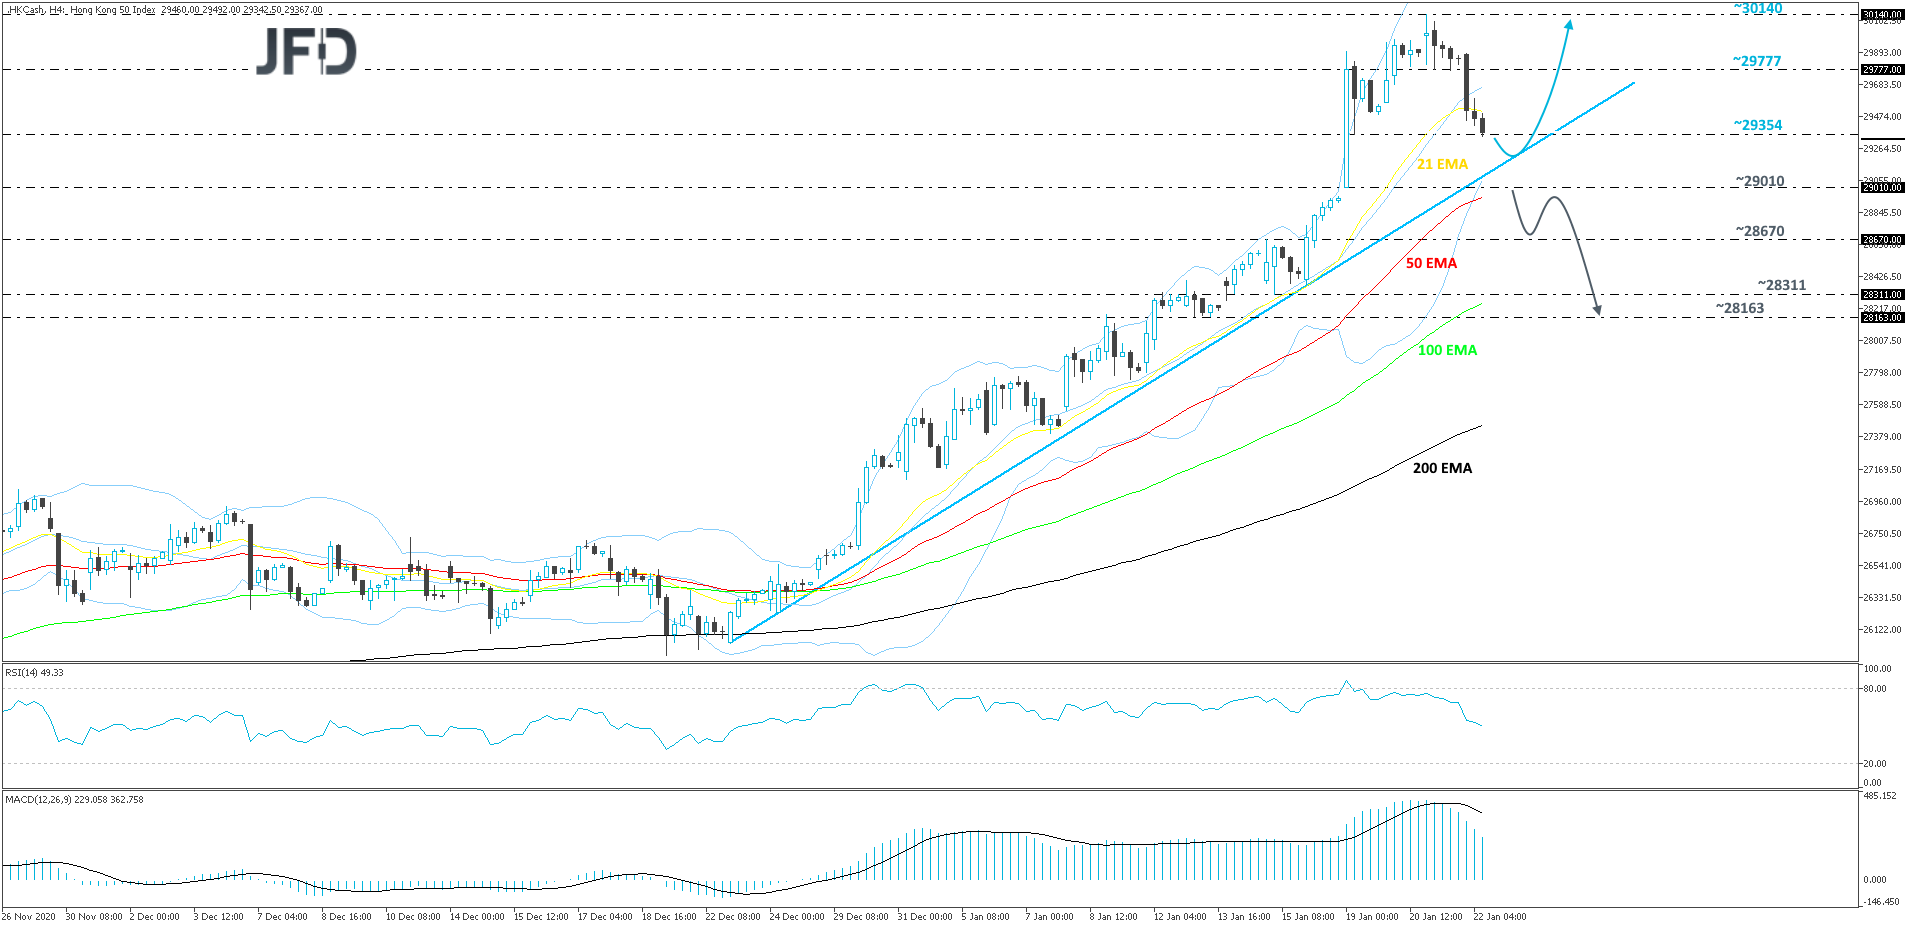
The technical picture of the Hang Seng cash index on our 4-hour chart shows that, at the time of writing, the price is drifting lower. However, given that the index continues to trade above a short-term upside support line, drawn from the low of December 23rd, the current slide might be seen as a temporary correction, before another possible leg of buying. As long as that upside line stays intact, we will remain somewhat positive with the near-term outlook.
As mentioned above, if the aforementioned upside line continues to hold, the price may rebound and, if it climbs back above the 21 EMA, the index could make its way back to the 29777 hurdle, marked by an intraday swing low of January 21st. If the buying doesn’t stop there, the next possible target might once again be the 30140 area, which is the current highest point of January.
The RSI and the MACD on our 4-hour chart are currently pointing slightly lower. However, the RSI is floating around 50 and the MACD, although below the trigger line, remains above zero. The two oscillators seem to be in support of the above-mentioned scenario.
The alternative scenario here would be if the price would break the previously-discussed upside line and then fall below the 29010 area, marked by the low of January 19th. At the same time, the price would be placed below the 50 EMA. This way more sellers could join in, possibly sending the index to the 28670 zone, which is the highest point of last week. Initially, Hang Seng might rebound somewhat from that zone, but if the rebound is short-lived, the price may reverse back down again. If this time the index is able to overcome that 28670 obstacle, this could open the way towards the 28311 hurdle, or to the 28163 level, marked by the lows of January 15th and 13th respectively.
Disclaimer:
The content we produce does not constitute investment advice or investment recommendation (should not be considered as such) and does not in any way constitute an invitation to acquire any financial instrument or product. The Group of Companies of JFD, its affiliates, agents, directors, officers or employees are not liable for any damages that may be caused by individual comments or statements by JFD analysts and assumes no liability with respect to the completeness and correctness of the content presented. The investor is solely responsible for the risk of his investment decisions. Accordingly, you should seek, if you consider appropriate, relevant independent professional advice on the investment considered. The analyses and comments presented do not include any consideration of your personal investment objectives, financial circumstances or needs. The content has not been prepared in accordance with the legal requirements for financial analyses and must therefore be viewed by the reader as marketing information. JFD prohibits the duplication or publication without explicit approval.
CFDs are complex instruments and come with a high risk of losing money rapidly due to leverage. 72.57% of retail investor accounts lose money when trading CFDs with the Company. You should consider whether you understand how CFDs work and whether you can afford to take the high risk of losing your money. Please read the full Risk Disclosure.
Copyright 2021 JFD Group Ltd.