


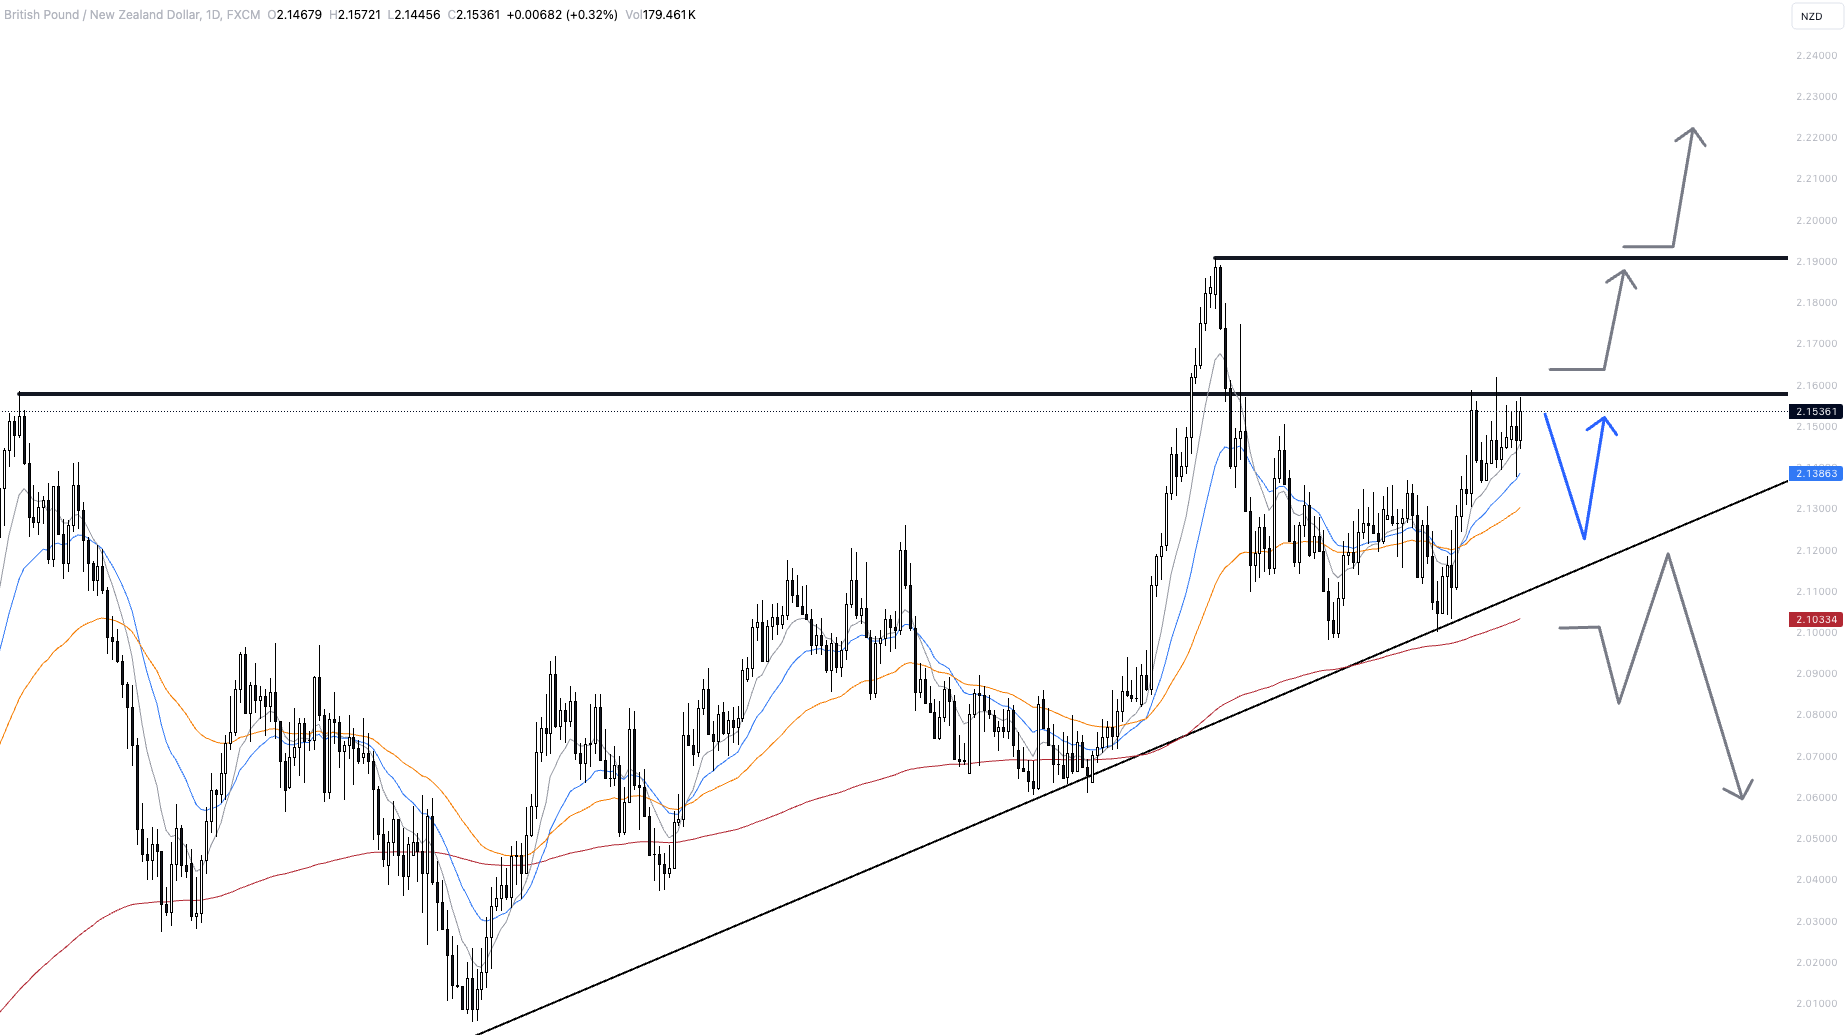
From a chart perspective, a significant horizontal resistance level is at 2.1600. Our main scenario envisages the price reversing to retest the lower side of the rising trend line at around 2.1250. Only a sustained rise above 2.1600 would release further potential up to 2.1900.
A drop below 2.10 would significantly darken the chart picture, and waves towards 2.0600 could follow.
.
.
.
Disclaimer:
The content we produce does not constitute investment advice or investment recommendation (should not be considered as such) and does not in any way constitute an invitation to acquire any financial instrument or product. The Group of Companies of JFD, its affiliates, agents, directors, officers or employees are not liable for any damages that may be caused by individual comments or statements by JFD analysts and assumes no liability with respect to the completeness and correctness of the content presented. The investor is solely responsible for the risk of his investment decisions. Accordingly, you should seek, if you consider appropriate, relevant independent professional advice on the investment considered. The analyses and comments presented do not include any consideration of your personal investment objectives, financial circumstances or needs. The content has not been prepared in accordance with the legal requirements for financial analyses and must therefore be viewed by the reader as marketing information. JFD prohibits the duplication or publication without explicit approval.
There are risks involved with trading of cash equities. Past performance is not indicative of future results. You should consider whether you can tolerate such losses before trading. Please read the full Risk Disclosure (https://www.jfdbrokers.com/en/legal/risk-disclosure).
Copyright 2024 JFD Group Ltd.