

The US dollar pulled back against all the other major currencies yesterday and today in Asia, with most equity indices trading in the green. However, with no clear catalyst behind the improvement in market sentiment, and no clear change in the fundamental landscape, we believe that this may have been due to portfolio rebalancing in the last day of a very turbulent month.
The US Pulls Back and Risk Assets Rebound, but no Change in Fundamentals
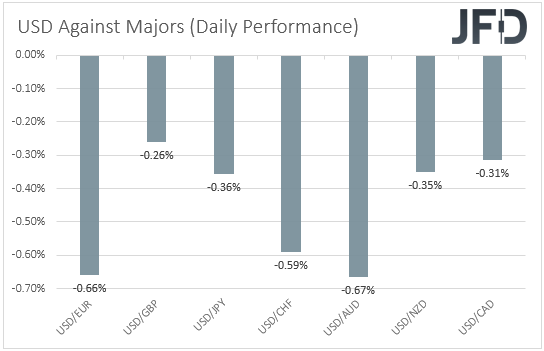
The US dollar traded lower against all the other major currencies on Monday and during the Asian session Tuesday. It lost the most ground versus AUD, EUR, and CHF in that order, while it underperformed the least versus GBP.
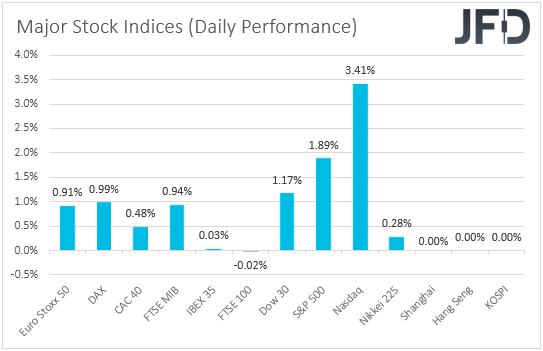
The weakening of the US dollar, combined with the strengthening of the Aussie, suggests a risk-on trading activity, but the strengthening of the Swiss franc points otherwise. Thus, in order to get a clearer picture with regards to the broader market sentiment, we prefer to turn our gaze to the equity world. There, we see that most European shares traded in the green, with optimism increasing during the US session. Today, in Asia, only Japan’s Nikkei was open, and it finished up as well.
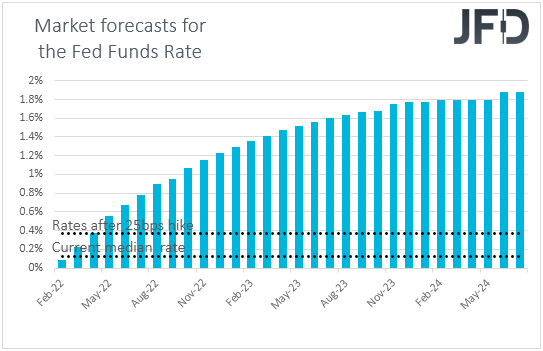
In our view, the fundamental landscape has barely changed. Still market participants anticipate a 25bps hike by the Fed in March and multiple more until the end of the year. Specifically, according to the Fed funds futures, investors are fully pricing in a total of nearly five quarter-point liftoffs by December. On top of that, the uncertainty surrounding Eastern Europe remains elevated, with the UK warning it is “highly likely” that Russia is looking to invade Ukraine.
So, with all that in mind, we believe that yesterday’s rebound in equities may have been the result of some portfolio rebalancing after a very poor start of the year. Specifically, Nasdaq avoided narrowly its worst ever January, while the S&P 500 recorded its weakest January since 2009. Even if equities continue to recover, as some investors may have already digested the idea of faster rate hikes, we prefer to adopt a cautious stance and take things step by step. At the moment, we prefer to trust some more recovery in European indices, and this is because we see the case for the ECB to lift interest rates much slower than the Fed. We still believe that Eurozone policymakers will avoid pressing the hike button this year.
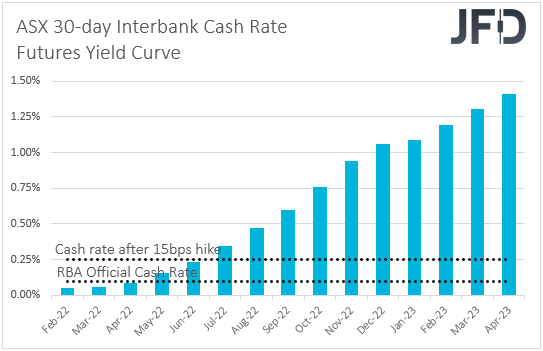
Now, back to the currencies, the Aussie was the best performing major currency, and, actually, if it wasn’t for the RBA, it could have gained more. The Bank decided on monetary policy during the Asian session today, keeping interest rates untouched at 0.10% and announcing the end of its QE purchases, as was broadly expected. However, in the statement accompanying the decision, it was noted that, while inflation has picked up, it is too early to conclude that it is sustainably within that target band, and that they will not increase the cash rate until that happens. The Aussie fell nearly 40 pips against its US counterpart at the time of the release, perhaps as the outcome was a clear message that the RBA is not willing to proceed with as many rate hikes as the current market pricing suggests. However, the currency was quick to bounce back and cover the RBA-related losses, perhaps aided by the broader risk recovery, or because most participants kept bets around the RBA’s rate path elevated. According to the ASX 30-day interbank cash rate futures yield curve, investors continue to see the OCR above 1.0% by the end of this year.
Euro Stoxx 50 – Technical Outlook
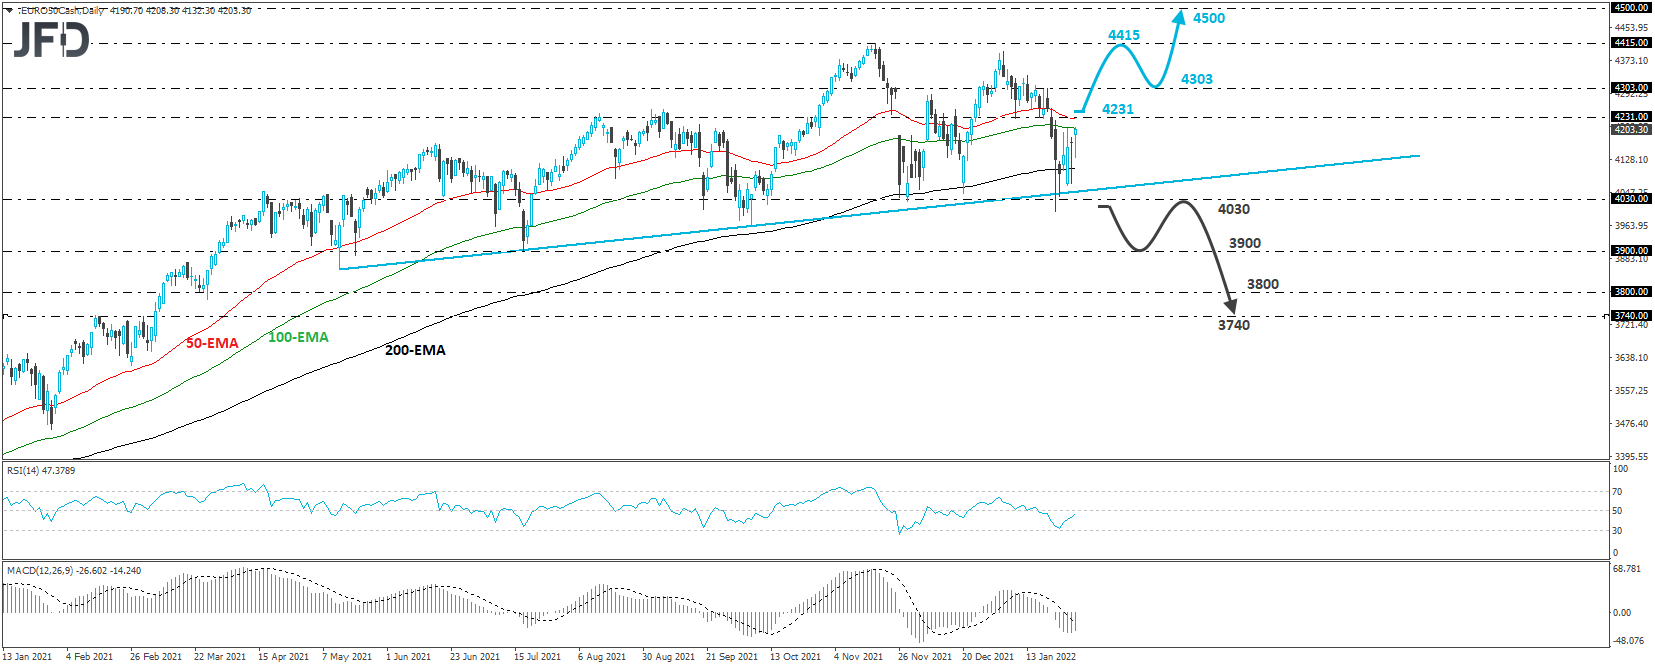
The Euro Stoxx 50 cash index traded higher on Monday, extending the recovery started on January 24th, after the index hit support near the crossroads of the upside support line drawn from the low of May 13th, and the 4030 barrier. As long as the index stays above that line, we would see decent chances for more advances in the short run.
A clear break above the 4231 barrier, marked by the inside swing lows of January 18th and 19th, could confirm the case and may initially target the 4303 zone, marked by the peak of January 20th. If market participants are not willing to stop there, then we could see them climbing towards the peak of January 18th, at 4415. Another break, above 4415, will take the index into territories last seen in December 2007, with the next resistance perhaps being the peak of that month, at around 4500.40
Now, in order to abandon the bullish case, we would like to see a clear dip below 4030, a territory that provided strong support between November 30th and January 24th. This could also confirm the break below the aforementioned upside line, and may initially pave the way towards the low of July 19th, at 3900. Another beak, below 3900, could extend the fall towards the 3800 zone, or the 3740 territory, marked by the inside swing high of March 3rd.
AUD/JPY – Technical Outlook
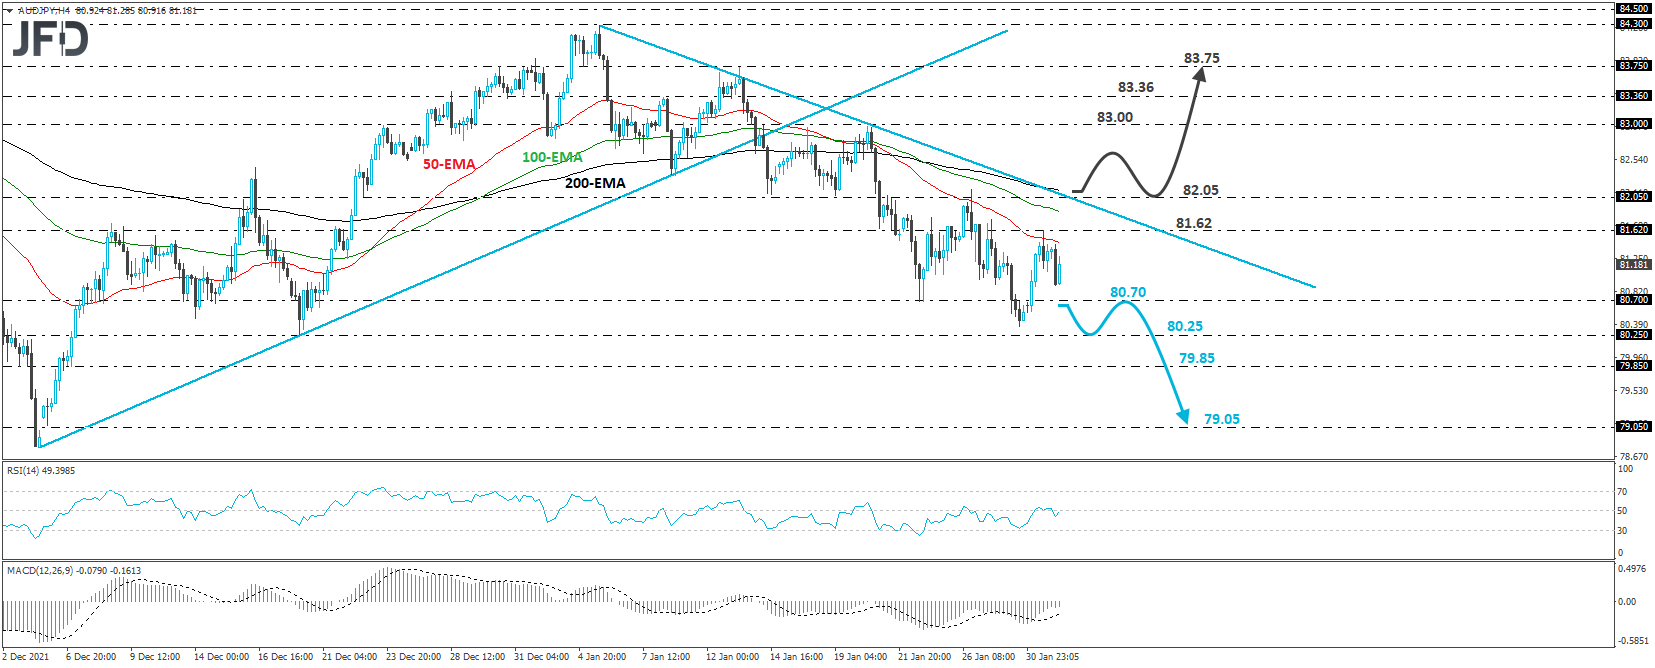
AUD/JPY traded lower after the RBA outcome, but quickly rebounded to recover those loses. However, the rate remains below the downside line taken from the high of January 5th, and thus, we believe that any further advances for now, could stay short-lived. We see decent chances for another leg south soon.
A clear dip below 80.70, marked by the low of January 24th, could confirm the notion and see scope for declines towards the low of December 20th, at 80.25, or the low of December 7th, at 79.85. If the bears are strong enough to overcome that barrier as well, then we may see them diving towards the 79.05 barrier, marked by the low of December 6th.
The outlook might change to positive upon a break above 82.05. This could confirm the break above the aforementioned downside line and may trigger advances towards the 83.00 zone, which provided resistance on January 18th and 20th. If the bulls are not willing to stop there, then we could see them climbing towards the 83.36 level, or the 83.75 zone, with the latter being marked by the high of January 13th.
As for Today’s Events
Today, we get the final manufacturing PMIs for January from the Eurozone, the UK, and the US, but as it is usually the case, they are expected to confirm their preliminary estimates. The US ISM manufacturing index for the month is also coming out and expectations are for a slide to 57.5 from 58.7. In Canada, the monthly GDP for November is expected to reveal a slowdown to +0.4% mom from +0.8%.
Tonight, during the early Asian morning Wednesday, New Zealand’s unemployment rate for Q4 is expected to have stayed unchanged, with the employment change expected to have slowed to +0.3% qoq from +2.0%. That said, the Labor Costs Index is expected to have accelerated to +2.9% yoy from +2.5%, keeping the door open for more rate hikes by the RBNZ.
Disclaimer:
The content we produce does not constitute investment advice or investment recommendation (should not be considered as such) and does not in any way constitute an invitation to acquire any financial instrument or product. The Group of Companies of JFD, its affiliates, agents, directors, officers or employees are not liable for any damages that may be caused by individual comments or statements by JFD analysts and assumes no liability with respect to the completeness and correctness of the content presented. The investor is solely responsible for the risk of his investment decisions. Accordingly, you should seek, if you consider appropriate, relevant independent professional advice on the investment considered. The analyses and comments presented do not include any consideration of your personal investment objectives, financial circumstances or needs. The content has not been prepared in accordance with the legal requirements for financial analyses and must therefore be viewed by the reader as marketing information. JFD prohibits the duplication or publication without explicit approval.
CFDs are complex instruments and come with a high risk of losing money rapidly due to leverage. 68.02% of retail investor accounts lose money when trading CFDs with the Company. You should consider whether you understand how CFDs work and whether you can afford to take the high risk of losing your money. Please read the full Risk Disclosure.
Copyright 2022 JFD Group Ltd.