

US and Asian equities traded in green waters after US House Speaker Nancy Pelosi reported progress in talks over a new fiscal stimulus package. We also had the second debate between Trump and Biden, with Biden seen as coming through better than Trump. As for today, investors are likely to lock their gaze on the preliminary PMIs for October for a taste on how the global economy has performed with the coronavirus keep spreading fast.
Pelosi Says Stimulus Legislation Could Pass “Pretty Soon”
The US dollar traded mixed on Thursday and during the Asian morning Friday. It gained against GBP, EUR, SEK, NOK, and CHF in that order, while it underperformed versus AUD, NZD, and CAD. The greenback was found virtually unchanged against JPY.
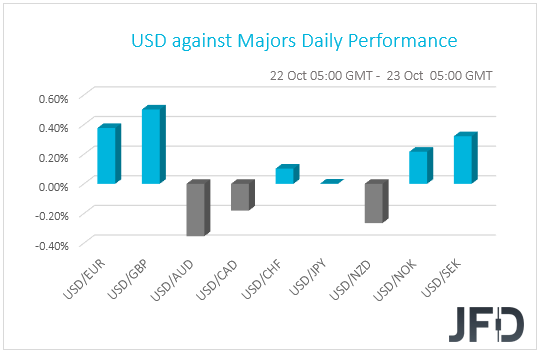
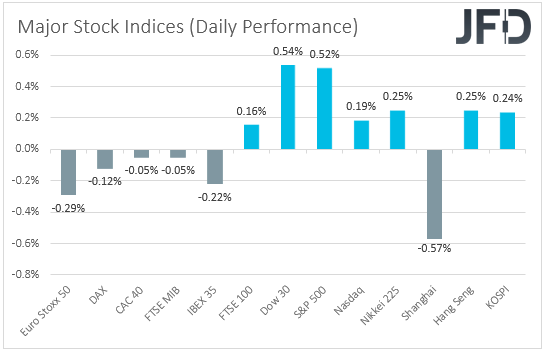
The strengthening of the commodity-linked currencies Aussie, Kiwi and Loonie, combined with the relative weakness in the Swiss franc, suggests that markets turned back to risk-on at some point yesterday. Indeed, although most major EU indices traded in the red (the exception was FTSE 100, which gained 0.16%), all three of the major US ones closed in positive territory, with the positive morale rolling into the Asian session today. Only China’s Shanghai Composite was down.
It seems that hopes over a potential fiscal package in the US returned after US House Speaker Nancy Pelosi reported progress in talks with the Trump administration and said that legislation could pass “pretty soon”. However, White House economic adviser Larry Kudlaw said that “significant policy differences” remain on the table, something that is unlikely to result in a deal before the November 3rd election.
On top of that, overnight we had the 2nd debate between incumbent President Donald Trump and the Democratic candidate Joe Biden. It was a more civilized debate compared to the previous one, with Biden coming through better than Trump according to market chatter. Perhaps that’s why Asian indices traded in the green. Remember that, yesterday, we noted that a Biden victory could prove positive for equities outside the US due to his potentially softer stance on international trade.
S&P 500 – Technical Outlook
The S&P 500 index continues to run inside a short-term falling channel formation, which is in play from around mid-October. Although the price recently made its way higher within that channel, still, if the upper side of that pattern remains intact, this may result in another slide. As long as the index remains inside that formation, the near-term outlook could stay a bit negative.
A small push higher could bring the S&P 500 to the upper bound of the channel, which if holds, might bring the sellers back into the game. If so, the index may drift to the 3446 obstacle again, a break of which could set the stage for a move to the current lowest point of this week, at 3410. Slightly below it sits another potential area, at 3395, marked by an intraday swing low of October 6th, which could also provide additional support.
On the upside, if the upper bound of the channel gets broken and the price rises above the high of October 20th, at 3478, that may attract more buyers into the game. The S&P 500 might then travel to the 3505 zone, marked by the current highest point of this week, which might provide a temporary hold-up. However, slightly above it lies another potential resistance area, that could get tested and that is at 3516, marked by the high of October 16th.
![]()
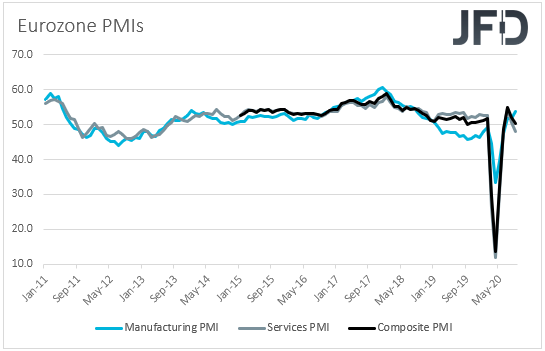
Preliminary PMIs Take Center Stage
As for today, focus is likely to fall on the preliminary manufacturing, services and composite PMIs for October from several Eurozone nations and the bloc as a whole, the UK and the US. These data sets will give us a first taste on how the global economy has performed during the month of October, with the coronavirus keep spreading fast and hitting new record highs in daily infections. Both the Eurozone manufacturing and services PMIs are expected to have declined to 53.1 and 47.0, from 53.7 and 48.0 respectively, something that will drive the composite PMI below the boom-or-bust zone of 50. Specifically, the composite index is forecast to have slid to 49.3 from 50.4. This is likely to prove negative for the euro, as it will reveal that the second wave of coronavirus infections is leaving more marks on the Euro-area economy.
In the UK, the manufacturing index is expected to have increased to 54.3 from 54.1, while the services one is anticipated to have declined to 55.0 from 56.1. This will result in a downtick in the composite PMI, to 55.6 from 55.7. With regards to the US data, the manufacturing PMI is forecast to have inched up to 53.4 from 53.2, while the services one is expected to have ticked down to 54.5 from 54.6.
EUR/GBP – Technical Outlook
EUR/GBP is currently trading near the lower bound of its short-term range, which is roughly between the 0.9007 and 0.9162 levels. Wednesday’s sharp decline and yesterday’s consolidation could also be forming a potential bearish flag. However, before examining lower areas, we would need to see a clear break below the lower bound of that range first. Until then, we will take a neutral approach.
If, eventually, the pair does drift below the 0.9007 hurdle, which is the lower side of the aforementioned range, that would also confirm a forthcoming lower low, potentially opening the door to further declines. EUR/GBP might then travel to an intraday swing low of September 7th, at 0.8962, a break of which may clear the way to the 0.8930 level. That level marks the low of September 7th.
On the other hand, if the rate fails to break the lower bound of the range and instead rises back above the 0.9079 barrier, marked by the inside swing low of October 20th, that may attract a few buyers back into the game. EUR/GBP may end up moving higher within the range, first hitting the 0.9109 obstacle, a break of which might set the stage for a push to the 0.9148 hurdle, or the 0.9162 level. The latter two areas mark the current high of this week and the current highest point of October.
![]()
As for the Rest of Today’s Events
The only other release worth mentioning is already out and it is the UK retail sales for September. Both the headline and core sales accelerated to +1.5% mom and +1.6% mom from +0.8% and +0.6%, beating estimates of a slowdown to +0.4% and +0.5% respectively.
As for the speakers, we have only one on today’s agenda and this is BoE Deputy Governor Dave Ramsden.
Disclaimer:
The content we produce does not constitute investment advice or investment recommendation (should not be considered as such) and does not in any way constitute an invitation to acquire any financial instrument or product. The Group of Companies of JFD, its affiliates, agents, directors, officers or employees are not liable for any damages that may be caused by individual comments or statements by JFD analysts and assumes no liability with respect to the completeness and correctness of the content presented. The investor is solely responsible for the risk of his investment decisions. Accordingly, you should seek, if you consider appropriate, relevant independent professional advice on the investment considered. The analyses and comments presented do not include any consideration of your personal investment objectives, financial circumstances or needs. The content has not been prepared in accordance with the legal requirements for financial analyses and must therefore be viewed by the reader as marketing information. JFD prohibits the duplication or publication without explicit approval.
CFDs are complex instruments and come with a high risk of losing money rapidly due to leverage. 84.25% of retail investor accounts lose money when trading CFDs with the Company. You should consider whether you understand how CFDs work and whether you can afford to take the high risk of losing your money. Please read the full Risk Disclosure.
Copyright 2020 JFD Group Ltd.