

The US dollar rebounded against all its major peers yesterday, after the US PPIs recorded their biggest increase in more than a decade. With producer prices feeding into consumer prices, this suggests that the CPIs may have not hit a celling yet and may have increased again bets on a potential tapering announcement by the Fed in September.
USD Gains as US PPIs Rally the Most in More than a Decade
The US dollar rebounded and outperformed all the other major currencies on Thursday and during the Asian session Friday. It gained the most ground versus NZD, GBP, and AUD in that order, while it eked out the least gains versus JPY and EUR.
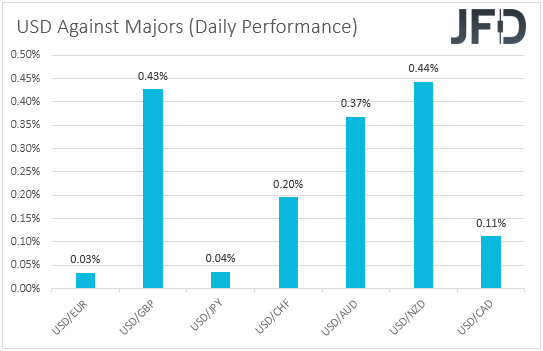
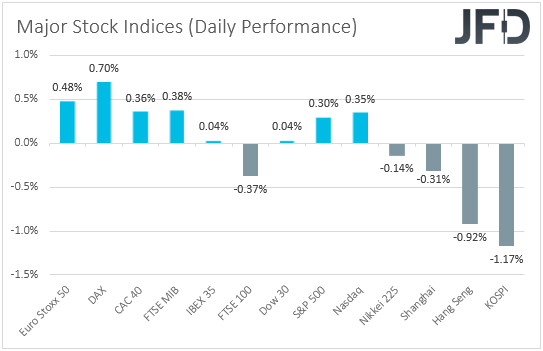
The strengthening of the US dollar and the yen, combined with the weakening of the risk-linked Kiwi and Aussie, suggests that markets turned to risk-off at some point. Looking at the performance of major equity indices though, we see that all but one of major EU bourses closed in the green, with the only exception being UK’s FTSE 100, which slid 0.37%. The optimism rolled somewhat over into the US session, with both the Dow Jones and the S&P 500 hitting fresh record highs. However, appetite deteriorated again during the Asian trading today, due to continued worries over the new regulatory crackdowns in China, as well as the fast spreading of the coronavirus Delta variant in Asia.
In yesterday’s report, we noted that despite the slowdown in Wednesday’s US CPIs for July, we would expect the greenback’s prevailing uptrend to resume soon. Yesterday’s rebound proves us correct. Although both headline and underlying inflation pressures slowed in monthly terms, the yoy rates remained elevated well above the Fed’s objective of 2%. What’s more, yesterday, both the headline and core PPI yoy rates for July jumped to +7.8% and 6.2% respectively, from 7.3% and 5.6%, posting their largest annual increase in more than a decade. With producer prices feeding into consumer prices, this suggests that the CPIs may have not hit a celling yet, and may have increased again bets on a potential tapering announcement by the Fed in September. Having said that though, that’s not set in stone yet. We could get more clarity on when QE tapering may begin at the Jackson Hole Economic Symposium, scheduled for the end of this month.
With all that in mind, we do expect the US dollar to continue drifting north, but equities are unlikely to react in a risk-off manner to tapering speculation. Remember, yesterday, we noted that stock indices seem to have continued conquering new highs, whatever market participants anticipate around the Fed. We saw Wall Street hitting records at times when normalization expectations were brought forth, perhaps as investors were rushing to take advantage low interest rates for as long as possible, but we also saw equities drifting north when such expectations were pushed back. This may have been due to the fact that low interest rates for longer mean low borrowing costs for companies for longer, as well as lower present values for longer.
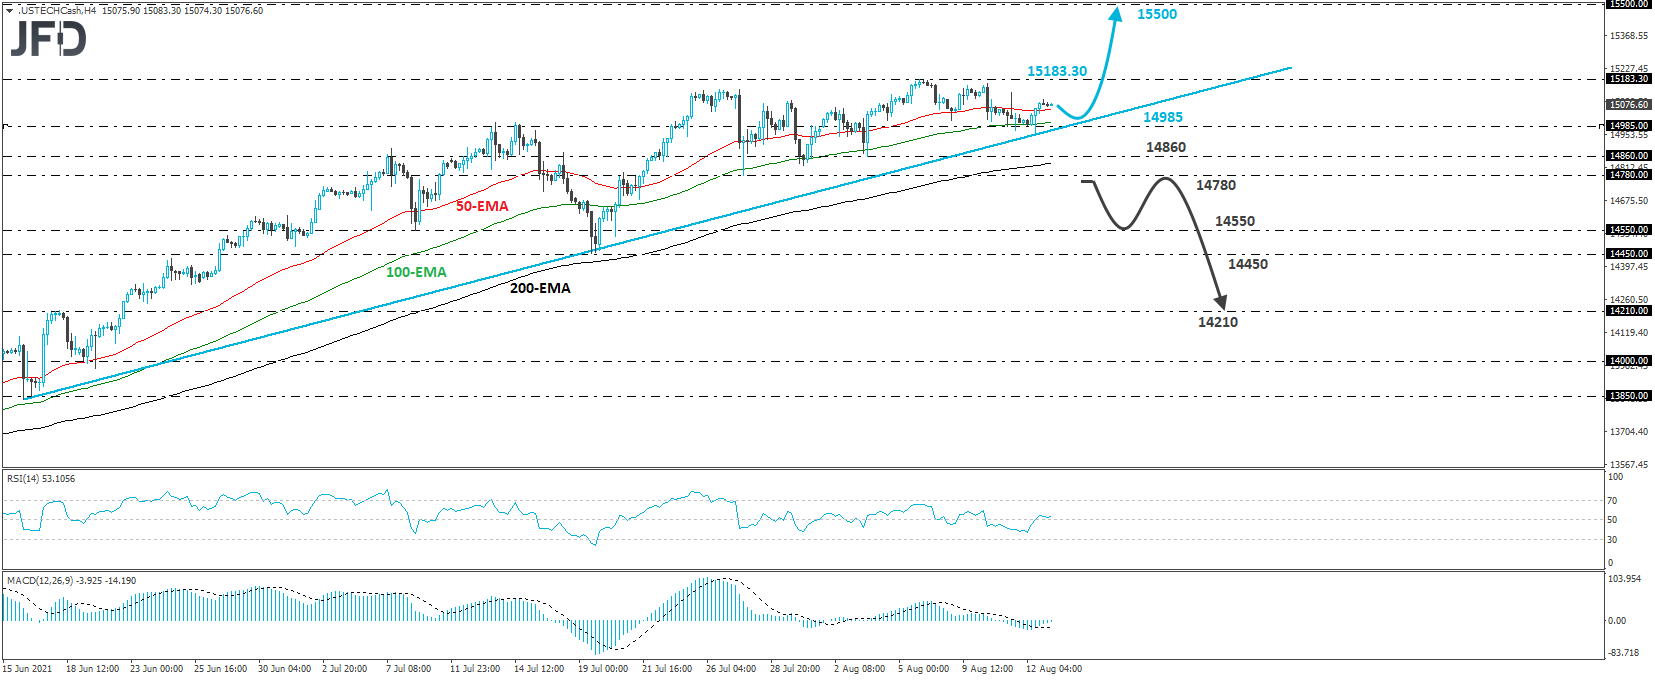
Nasdaq 100 – Technical Outlook
The Nasdaq 100 cash index traded higher yesterday, after it hit support at the upside support line drawn from the low of June 16th, slightly below the 14985 support zone. Although, the index has been struggling to rise to new records recently, as long as it stays above that line, we will hold a positive stance.
We do see the case for the bulls to stay in the driver’s seat and perhaps aim for the record peak of 15183.30, hit on August 6th. If they are not willing to stop there and push the index into the uncharted territory, we will consider as the next potential resistance territory the round number of 15500.
On the downside, we would like to see a dip below 14780 before we start examining a short-term bearish reversal. The index would already be below the aforementioned upside line and thus, we could see declines towards the 14550 or 14450 barriers, defined as supports by the lows of July 8th and 19th respectively. Another break, below 14450 could extend the fall towards the inside swing high of June 18th, at around 14210.
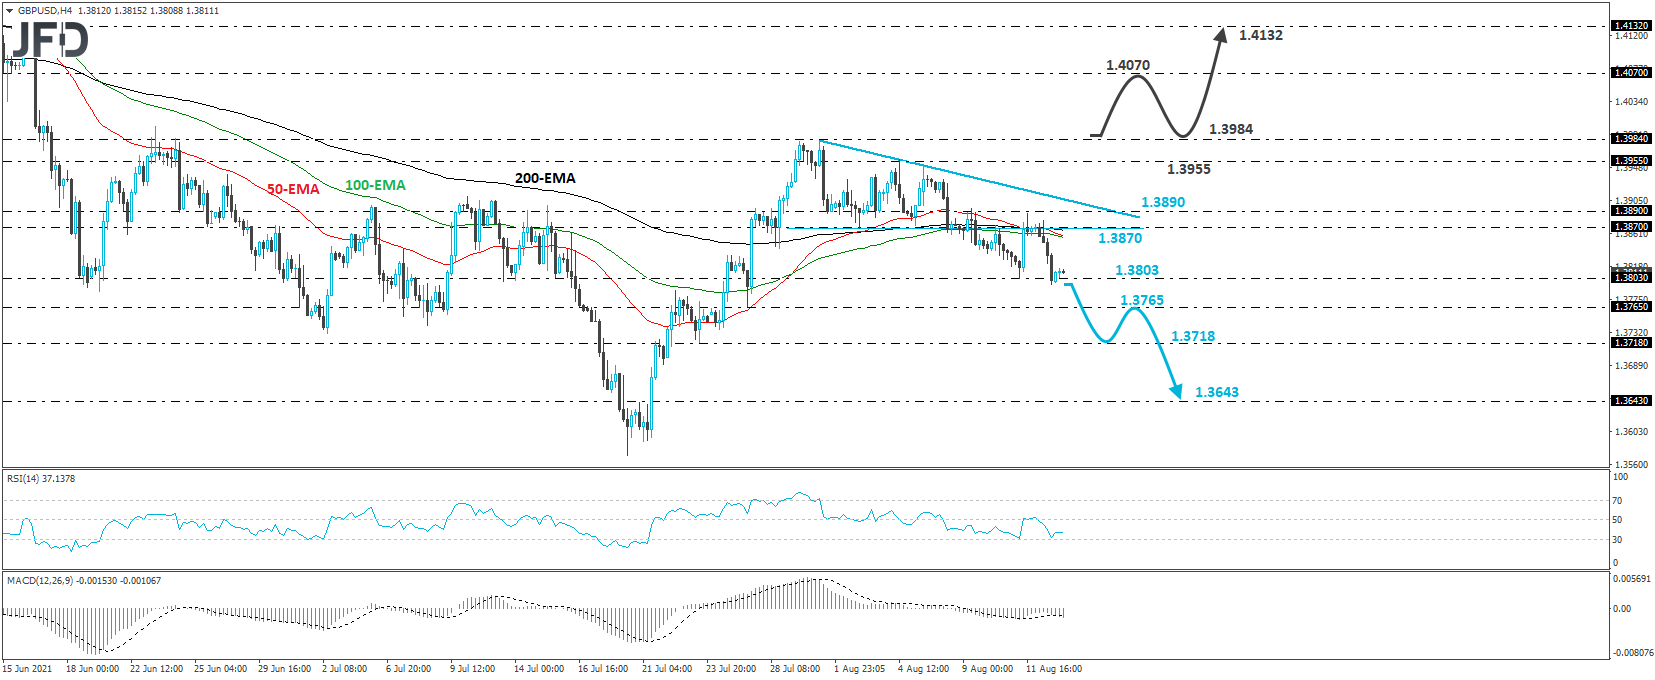
GBP/USD – Technical Outlook
GBP/USD fell sharply yesterday, to stop and hover near Wednesday’s low of 1.3803. Overall, the pair is now trading below the lower end of the descending triangle that contained the price action from July 28th until August 9th, and thus, we would consider the short-term picture to be bearish for now.
A strong move below 1.3803 would confirm a forthcoming lower low on the 4-hour chart and could initially target the 1.3765 level, marked by the low of July 27th. If that level doesn’t hold, then we could see the decline extending towards the low of July 23rd, at 1.3718, the break of which could see set the stage for the 1.3643 territory, defined as a support by the inside swing high of July 21st.
In order to consider the bullish case, we would like to see a rebound all the way above the 1.3984 barrier, marked as a resistance by the high of July 30th. This would confirm a forthcoming higher high on the daily chart and could encourage the buyers to aim for the 1.4070 area, marked by the inside swing low of June 10th. If they don’t stop there, the next hurdle to consider may be the high of June 16th, at 1.4132.
As for Today’s Events
The only release worth mentioning on today’s agenda is the preliminary UoM consumer sentiment index for August, which is expected to have held steady at 81.2.
Disclaimer:
The content we produce does not constitute investment advice or investment recommendation (should not be considered as such) and does not in any way constitute an invitation to acquire any financial instrument or product. The Group of Companies of JFD, its affiliates, agents, directors, officers or employees are not liable for any damages that may be caused by individual comments or statements by JFD analysts and assumes no liability with respect to the completeness and correctness of the content presented. The investor is solely responsible for the risk of his investment decisions. Accordingly, you should seek, if you consider appropriate, relevant independent professional advice on the investment considered. The analyses and comments presented do not include any consideration of your personal investment objectives, financial circumstances or needs. The content has not been prepared in accordance with the legal requirements for financial analyses and must therefore be viewed by the reader as marketing information. JFD prohibits the duplication or publication without explicit approval.
CFDs are complex instruments and come with a high risk of losing money rapidly due to leverage. 73.90% of retail investor accounts lose money when trading CFDs with the Company. You should consider whether you understand how CFDs work and whether you can afford to take the high risk of losing your money. Please read the full Risk Disclosure.
Copyright 2021 JFD Group Ltd.