


Repsol SA (BME: REP) is a Spanish energy and petrochemical company established in 1987. From around mid-2007, the company’s share price has been on a decline, with occasional swings back to the upside, mirroring the overall price performance of the oil market. Repsol SA was not able to differentiate itself from any other major petrochemical firm, hence the relatively poor performance of the stock overall. However, recently, the Spanish company decided to stress the importance of the biofuel sector. Given that the world is swamped by various residues of different organic products, creating biodiesel, biojet, bionaphtha, and biopropane from those materials could be a good solution towards lowering carbon emissions. Also, due to a rising popularity of publicly traded companies, which emphasize the importance of reducing their carbon footprint, such firms are included into new eco-funds that are attracting a new generation of investors. Repsol SA might not only benefit from the current sharp rise in oil prices, but it could stay attractive to future investors, as an eco-friendly firm, even when oil prices drop. This is why the Spanish petrochemical giant is now building a new biofuel plant at the Repsol’s Cartagena plant in the south-eastern part of Spain, a move that may prove itself worthwhile for the company’s survival in the future.
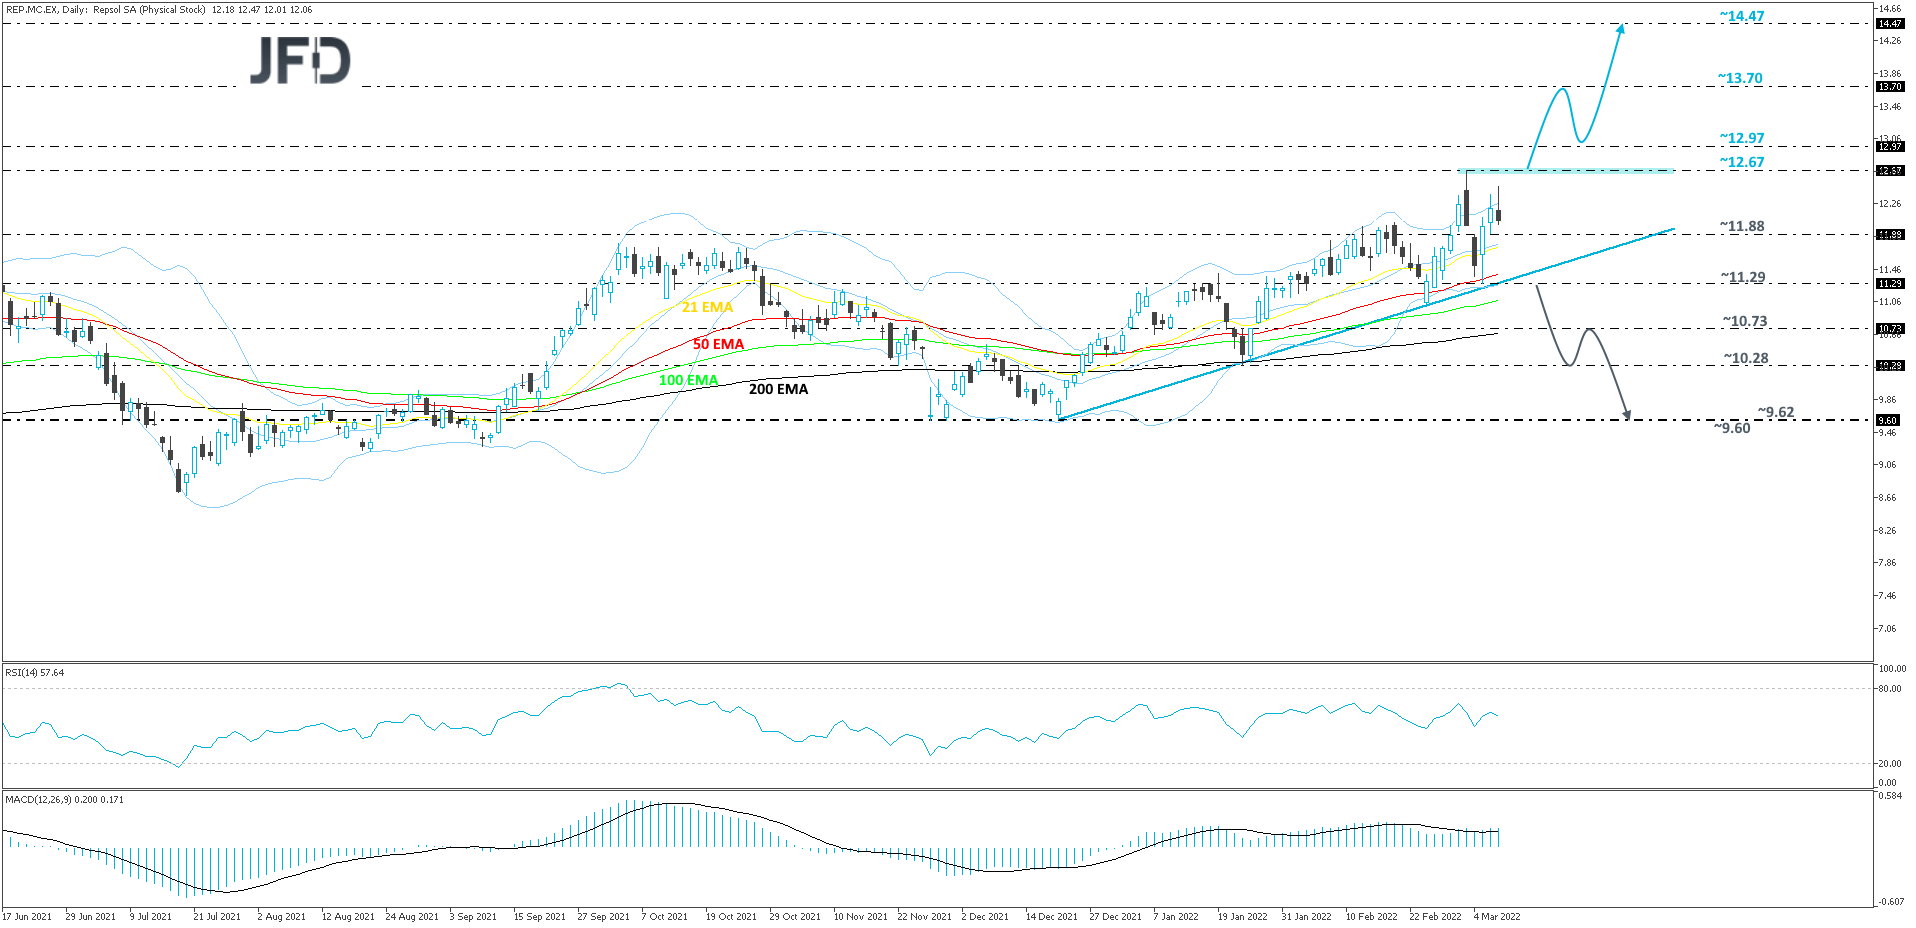
The technical picture of REP shows that the share price has been slowly grinding north, after reversing higher in the end of October 2020. From December 20th, 2021, the stock is seen trading above a short-term upside support line and continues to trade above all of its EMAs on our daily chart. If the stock continues to trade above that upside line, the trend may stay to the upside. That said, to get a bit more comfortable with that idea, we would prefer to wait for a breakout above the 12.67 barrier first, which is the current highest point of March.
If that break happens, this will confirm a forthcoming higher high, possibly setting the stage for further advances. REP may travel to the 12.97 obstacle, or even to the 13.70 zone, marked by the lowest points of November and December of 2019. Around there, the stock could stall for a bit, however, if the buyers remain active, that zone might be seen as a temporary pit-stop before advancing higher. The next potential target could be at 14.47, which is the current highest point of this year.
The RSI is currently pointing lower but remains above 50. The MACD is flat but continues to run above zero and the trigger line. Overall, the two oscillators show positive price momentum, which supports the upside scenario.
Alternatively, if the stock breaks the aforementioned upside line and then falls below the current lowest point of March, at 11.29, that could change the direction of the current short-term trend. REP may then fall to the 10.73 obstacle, or to the 10.28 hurdle, which is the lowest point of January and the current lowest point of this year. If there are still no new buyers around that hurdle, the share price might continue to slide and the next possible target could be between the 9.60 and 9.62 levels, marked by the lowest points of November and December 2021.
Disclaimer:
The content we produce does not constitute investment advice or investment recommendation (should not be considered as such) and does not in any way constitute an invitation to acquire any financial instrument or product. The Group of Companies of JFD, its affiliates, agents, directors, officers or employees are not liable for any damages that may be caused by individual comments or statements by JFD analysts and assumes no liability with respect to the completeness and correctness of the content presented. The investor is solely responsible for the risk of his investment decisions. Accordingly, you should seek, if you consider appropriate, relevant independent professional advice on the investment considered. The analyses and comments presented do not include any consideration of your personal investment objectives, financial circumstances or needs. The content has not been prepared in accordance with the legal requirements for financial analyses and must therefore be viewed by the reader as marketing information. JFD prohibits the duplication or publication without explicit approval.
There are risks involved with trading of cash equities. Past performance is not indicative of future results. You should consider whether you can tolerate such losses before trading. Please read the full Risk Disclosure.
Copyright 2022 JFD Group Ltd.