

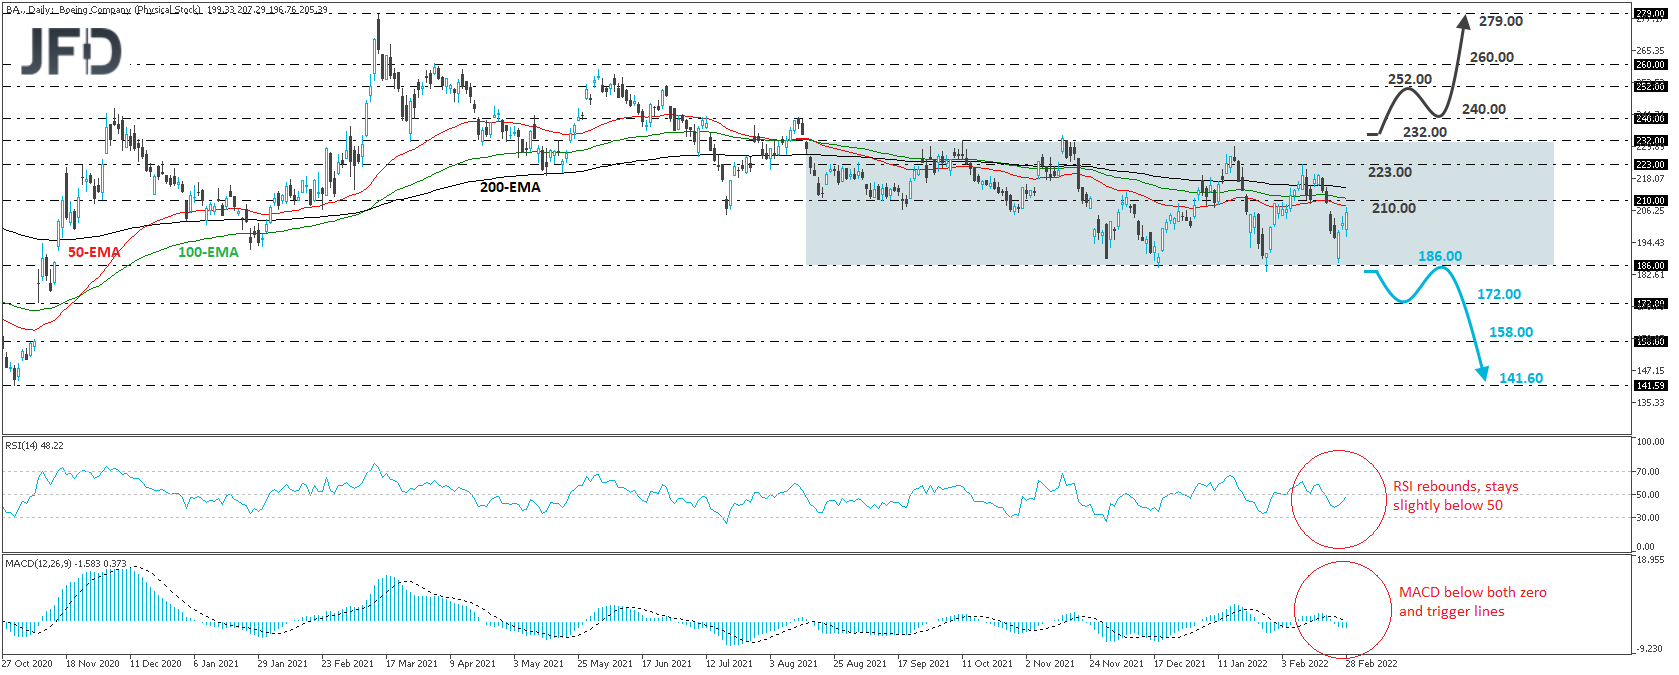
The Boeing Co. stock (NYSE: BA) has been in a recovery mode since Thursday, when it hit support at 186.00, the lower end of the sideways range that’s been containing the price action since August 16th. The upper end of the range is the 232.00 zone, and thus, as long as the stock is trading between those two boundaries, we will maintain a neutral stance.
In order to start examining whether the outlook has turned bearish, we would like to see a clear dip below 186.00. This will confirm a forthcoming lower low on the daily and weekly charts and may allow declines towards the 172.00 zone, marked by the low of November 9th, 2020. If there are no buyers to be found near that zone, then a break lower could pave the way towards the 158.00 zone, marked near the high of November 6th, the break of which could see scope for declines towards the low of October 30th, at 141.60.
Taking a look at our daily oscillators, we see that the RSI, although below 50, turned up, while the MACD, although below both its zero and trigger lines, shows signs of bottoming. Both indicators detect slowing downside speed and suggest that some further recovery within the range may be possible, before the next leg south.
The picture could turn back positive upon a break above 232.00, the upper end of the aforementioned range. This may encourage investors to push towards the 240.00 zone, which is marked by the high of August 12th, the break of which could allow extensions towards the 252.00 or 260.00 barriers, marked by the peaks of June 25th and April 5th, respectively. If neither barrier is able to halt the advance, then we may see the stock climbing towards the peak of March 15th, at around 279.00.
Disclaimer:
The content we produce does not constitute investment advice or investment recommendation (should not be considered as such) and does not in any way constitute an invitation to acquire any financial instrument or product. The Group of Companies of JFD, its affiliates, agents, directors, officers or employees are not liable for any damages that may be caused by individual comments or statements by JFD analysts and assumes no liability with respect to the completeness and correctness of the content presented. The investor is solely responsible for the risk of his investment decisions. Accordingly, you should seek, if you consider appropriate, relevant independent professional advice on the investment considered. The analyses and comments presented do not include any consideration of your personal investment objectives, financial circumstances or needs. The content has not been prepared in accordance with the legal requirements for financial analyses and must therefore be viewed by the reader as marketing information. JFD prohibits the duplication or publication without explicit approval.
There are risks involved with trading of cash equities. Past performance is not indicative of future results. You should consider whether you can tolerate such losses before trading. Please read the full Risk Disclosure.
Copyright 2022 JFD Group Ltd.