


Banco Santander Stock Gets A Boost | Technical Analysis
This morning, Banco Santander SA (BME: SAN) came out with an announcement saying that their net profit for Q3 had beaten the 1 billion euros estimate, coming out at 1.75 billion euros. This has also been a much better result than the previous one for the same period last year. The profits were boosted by good results in Santander’s operations in Europe and by even better results from the Americas. Only in Brazil the banks lending rose 20% from a year earlier, supported by gains in credit cards and mortgages. The bank is expected to generate a billion euros in savings by the end of 2020 and another 1 billion euros by the end of 2022. At the same time, Santander is planning to cut around 3000 jobs in Spain, in order to protect itself from financial turmoil in the future. For now, the Spanish banking giant is trying to fight the ruling of the ECB to ban Santander from paying dividends to its shareholders. Santander is arguing that such measures of the Central Bank are damaging the SAN stock price and the economy itself, because it restricts the flow of capital.
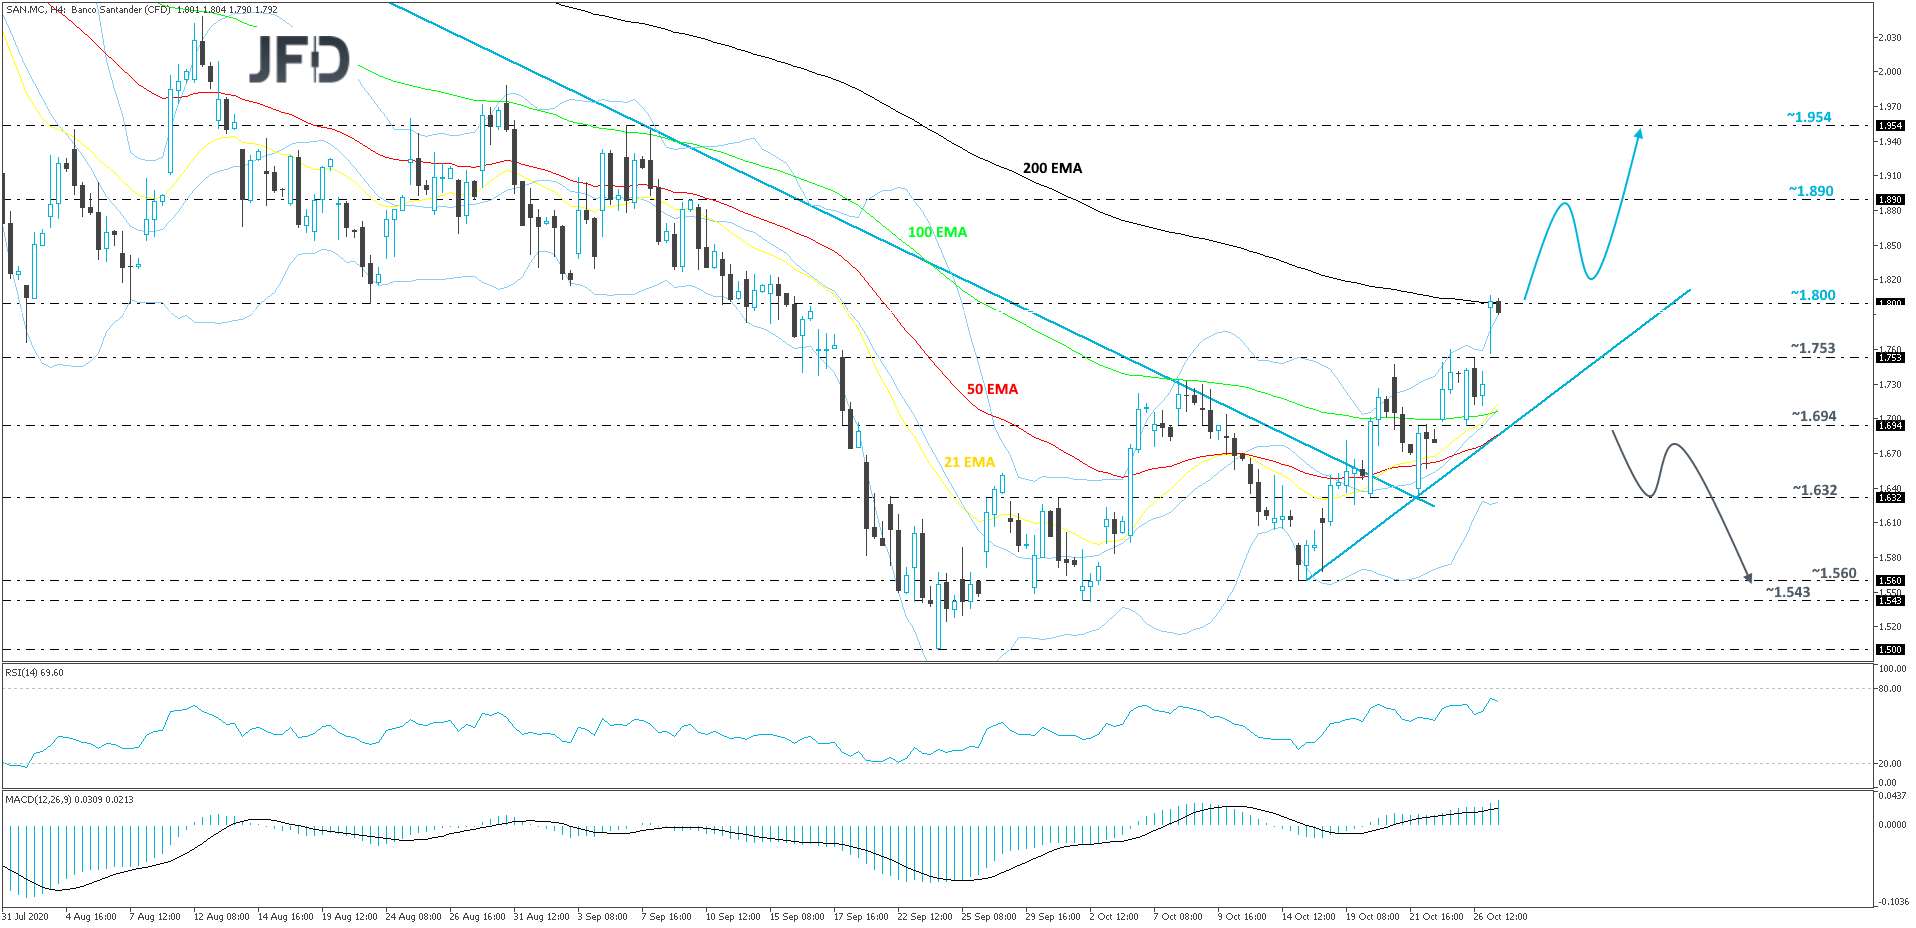
The technical picture of SAN is currently on the positive side, as the stock continues to balance above a short-term tentative upside support line drawn from the low of October 15th, which shows that the price is forming higher lows. SAN is also making higher highs, but looking at our 4-hour chart, we can see that it found some resistance near the 200 EMA. As long as the share price continues to balance above that upside line, the stock may continue drifting higher, however, to get a bit more comfortable with higher areas, we would first prefer to wait for a move above the 1.800 barrier, marked by the lows of August 7th, 21st and September 11th, together with a push above that 200 EMA.
A strong push above the 200 EMA might open the way to some higher areas, like the 1.890 territory, which is the high of September 9th. That’s where the stock may stall for a bit, or even retrace back down slightly. That said, if the price is able to stay above the 200 EMA, or above the aforementioned upside line, new buyers could step in and drive SAN north again. If this time the share price can overcome the 1.890 obstacle, the next potential resistance area could be at 1.954, marked by the high of September 7th.
Despite the RSI currently pointing slightly lower, it continues to stay well above 50. The MACD is pointing higher, while balancing above zero and its trigger line. The two oscillators are showing positive price momentum, which supports the above-discussed scenario.
Alternatively, if SAN breaks the aforementioned upside line and then slides below the 1.694 hurdle, marked by the low of October 26th, that could spook some new buyers from entering any time soon, as such a move may increase the stock’s chances of drifting further down. The share price might end up falling to the 1.632 hurdle, a break of which could open the way for a test of the 1.560 level, marked by the low of October 15th.
Disclaimer:
The content we produce does not constitute investment advice or investment recommendation (should not be considered as such) and does not in any way constitute an invitation to acquire any financial instrument or product. The Group of Companies of JFD, its affiliates, agents, directors, officers or employees are not liable for any damages that may be caused by individual comments or statements by JFD analysts and assumes no liability with respect to the completeness and correctness of the content presented. The investor is solely responsible for the risk of his investment decisions. Accordingly, you should seek, if you consider appropriate, relevant independent professional advice on the investment considered. The analyses and comments presented do not include any consideration of your personal investment objectives, financial circumstances or needs. The content has not been prepared in accordance with the legal requirements for financial analyses and must therefore be viewed by the reader as marketing information. JFD prohibits the duplication or publication without explicit approval.
There are risks involved with trading of cash equities. Past performance is not indicative of future results. You should consider whether you can tolerate such losses before trading. Please read the full Risk Disclosure.
Copyright 2020 JFD Group Ltd.